Great Red Spot
2008/9 Schools Wikipedia Selection. Related subjects: Space (Astronomy)
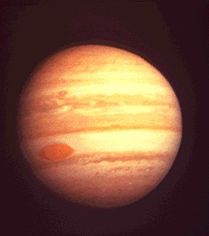
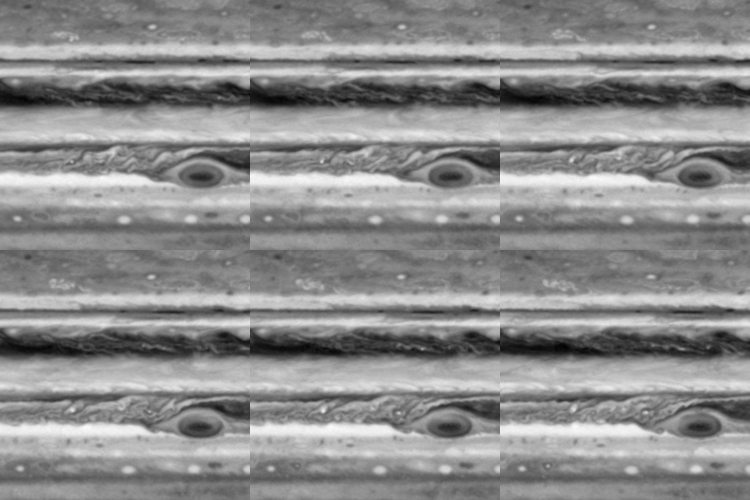
The Great Red Spot is a persistent anticyclonic storm on the planet Jupiter, 22° south of the equator, which has lasted for at least 178 years and possibly as long as 343 years or more. The storm is large enough to be visible through Earth-based telescopes. It was probably first observed by Giovanni Domenico Cassini, who described it around 1665. The spot has been noticeably red at times throughout its observed history, yet has not been appreciably red in the visible spectrum since a rather brief period in the mid 1970s.
Storms such as this are not uncommon within the turbulent atmospheres of gas giants. Jupiter also has white ovals and brown ovals, which are lesser unnamed storms. White ovals tend to consist of relatively cool clouds within the upper atmosphere. Brown ovals are warmer and located within the "normal cloud layer". Such storms can last hours or centuries.
Before the Voyager missions, astronomers were highly uncertain of the Red Spot's nature. Many believed it to be a solid or liquid feature on Jupiter's surface.
Observation history
The Great Red Spot appears at first to be remarkably stable, and most sources concur that it has been continuously observed for 300 years. However, the situation is more complex than that; the present spot was first seen only after 1830 and well-studied only after a prominent apparition in 1879. A long gap separates its period of current study after 1830 from its seventeenth-century discovery; whether the original spot dissipated and re-formed, whether it faded, or even if the observational record was simply poor are all unknown.
For example its first sighting is often credited to Robert Hooke, who described a spot on the planet in May 1664; however, it is likely that Hooke's spot was in the wrong belt altogether (the North Equatorial Belt, versus the current Great Red Spot's location in the South Equatorial Belt). Much more convincing is Giovanni Cassini's description of a "permanent spot" the following year. With fluctuations in visibility, Cassini's spot was observed from 1665 to 1713; however, the 118-year observational gap makes the identity of the two spots inconclusive, and the older spot's shorter observational history and slower motion than the modern spot make their identity unlikely.
A minor mystery concerns a Jovian spot depicted in a 1711 canvas by Donato Creti, which is exhibited in the Vatican. Part of a series of panels in which different (magnified) heavenly bodies serve as backdrops for various Italian scenes, and all overseen by the astronomer Eustachio Manfredi for accuracy, Creti's painting is the first known to depict the GRS as red. Worth noting is the fact that no Jovian feature was officially described as red before the late 1800s.
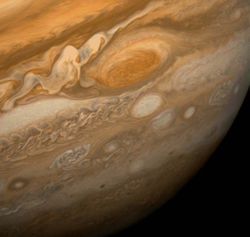
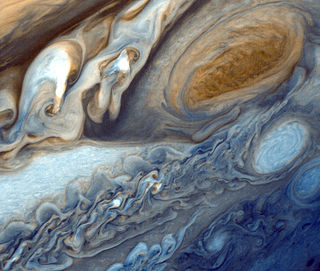
On February 25, 1979, when the Voyager 1 spacecraft was 9.2 million km (5.7 million miles) from Jupiter it transmitted the first detailed image of the Great Red Spot back to Earth. Cloud details as small as 160 km (100 miles) across were visible. The colorful, wavy cloud pattern seen to the left (west) of the Red Spot is a region of extraordinarily complex and variable wave motion.
At the start of 2004, the Great Red Spot had approximately half the longitudinal extent it had a century ago, when it reached a size of 40,000 km. At the present rate of reduction it would become circular by 2040, although this is unlikely because of the distortion effect of the neighboring jet streams. It is not known how long the spot will last, or whether the change is a result of normal fluctuations.
A smaller spot, designated Oval BA, formed recently from the merger of three white ovals, has turned reddish in colour. Astronomers have christened it the Little Red Spot or Red, Jr. As of June 5, 2006, the Great Red Spot and Oval BA appeared to be approaching convergence. The storms pass each other about every two years, but the passings of 2002 and 2004 did not produce anything exciting. But Dr. Amy Simon-Miller, of the Goddard Space Flight Centre, predicted the storms would have their closest passing on July 4, 2006. Simon-Miller had been working with Dr. Imke de Pater and Dr. Phil Marcus of UC Berkeley, and a team of professional astronomers since April, studying the storms using the Hubble Space Telescope. On July 20, the two storms were photographed passing each other by the Gemini Observatory without converging. In May 2008 a third storm turned red.
The Great Red Spot should not be confused with the Great Dark Spot, a feature observed near the northern pole of Jupiter in 2000 with the Cassini–Huygens spacecraft. Note that a feature in the atmosphere of Neptune was also called the Great Dark Spot. The latter feature was imaged by Voyager 2 in 1989, and may have been an atmospheric hole rather than a storm and it was no longer present as of 1994 (although a similar spot had appeared farther to the north).
Structure
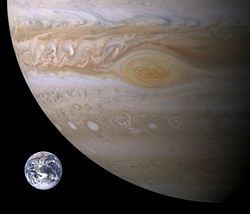
The oval object rotates counterclockwise, with a period of about six Earth days or 14 Jovian days. The Great Red Spot's dimensions are 24–40,000 km west to east and 12–14,000 km south to north. It is large enough to contain two or three planets the size of Earth. The cloudtops of this storm are about 8 km above the surrounding cloudtops.
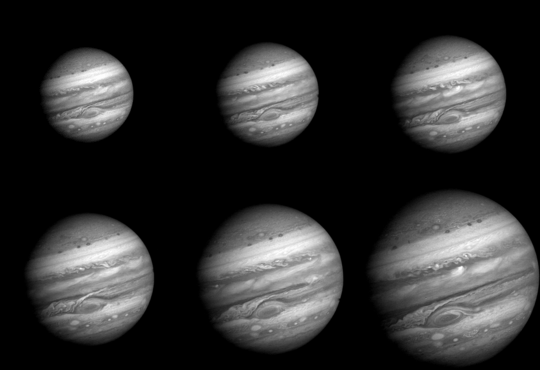
Infrared data has long indicated that the Great Red Spot is colder (and thus, higher in altitude) than most of the other clouds on the planet. Furthermore, careful tracking of atmospheric features revealed the spot's counterclockwise circulation as far back as 1966, observations dramatically confirmed by the first time-lapse movies from the Voyager flybys. The spot is confined by a modest eastward jet stream to its south and a very strong westward one to its north. Though winds around the edge of the spot peak at ~120 m/s (430 km/h), currents inside it seem stagnant, with little inflow or outflow. The rotation period of the spot has decreased with time, perhaps as a direct result of its steady reduction in size.
The Great Red Spot's latitude has been stable for the duration of good observational records, typically varying by about a degree. Its longitude, however, is subject to constant variation. Because Jupiter does not rotate uniformly, astronomers had defined three different systems for defining the longitude. System II is used for longitudes of more than 10°, and was originally based on the average rotation rate of the Great Red Spot of 9h 55m 42s. Despite this, however, the spot has "lapped" the planet in System II at least 10 times since the early nineteenth century. Its drift rate has changed dramatically over the years and has been linked to the brightness of the South Equatorial Belt, and the presence or absence of a South Tropical Disturbance.
It is not known exactly what causes the Great Red Spot's reddish color. Theories supported by laboratory experiments suppose that the colour may be caused by complex organic molecules, red phosphorus, or yet another sulphur compound, but a consensus has yet to be reached.
The Great Red Spot varies greatly in hue, from almost brick-red to pale salmon, or even white. In fact, the spot occasionally "disappears", becoming evident only through the Red Spot Hollow, which is its niche in the South Equatorial Belt (SEB). Interestingly, its visibility is apparently coupled to the SEB; when the belt is bright white, the spot tends to be dark, and when it is dark, the spot is usually light. These periods when the spot is dark or light occur at irregular intervals; as of 1997, during the preceding 50 years, the spot was darkest in the periods 1961-66, 1968-75, 1989-90, and 1992-93.
Mechanics
As the hot gases that comprise Jupiter's atmosphere rise from lower levels to higher levels, eddies form and converge. As cooler gas falls back, the Coriolis force causes swirling motion across a region that may be many kilometers in diameter. These eddies can last for a long time, because there is no solid surface to provide friction and because colder cloud tops above the eddy allow little energy to escape by radiation. Once formed, such eddies are free to move, merging with or affecting the behaviour of other storm systems in the atmosphere. It is theorized that this mechanism formed the Great Red Spot. According to this theory, many adjacent eddies are engulfed and merge with the spot, adding to the energy of the storm and contributing to its longevity.
