Image:IPCC AR4 WGIII GHG concentration stabilization levels.png
From Wikipedia, the free encyclopedia
Size of this preview: 640 × 327 pixels
Full resolution (1,431 × 731 pixels, file size: 122 KB, MIME type: image/png)
| |
This is a file from the Wikimedia Commons. The description on its description page there is shown below. |
Summary
| Description |
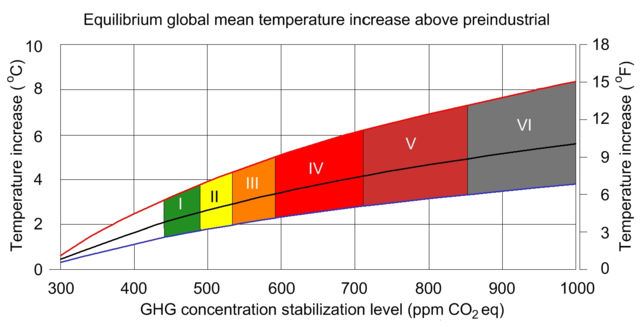
Greenhouse Gas Concentration Stabilization Level Scenario Categories. Self-drawn based on Figure SPM 8 in the IPCC Fourth Assessment Report, Working Group III, Summary for Policymakers. The text in the report reads: |
|---|---|
| Source |
self-made |
| Date |
2007-06-22 |
| Author |
Gralo |
| Permission ( Reusing this image) |
see below
|
Licensing
 |
I, Gralo, the copyright holder of this work, hereby release it into the public domain. This applies worldwide. In case this is not legally possible: Afrikaans | Alemannisch | Aragonés | العربية | Asturianu | Български | Català | Cebuano | Česky | Cymraeg | Dansk | Deutsch | Eʋegbe | Ελληνικά | English | Español | Esperanto | Euskara | Estremeñu | فارسی | Français | Galego | 한국어 | हिन्दी | Hrvatski | Ido | Bahasa Indonesia | Íslenska | Italiano | עברית | Kurdî / كوردی | Latina | Lietuvių | Latviešu | Magyar | Македонски | Bahasa Melayu | Nederlands | Norsk (bokmål) | Norsk (nynorsk) | 日本語 | Polski | Português | Ripoarisch | Română | Русский | Shqip | Slovenčina | Slovenščina | Српски / Srpski | Suomi | Svenska | ไทย | Tagalog | Türkçe | Українська | Tiếng Việt | Walon | 中文(简体) | 中文(繁體) | zh-yue-hant | +/- |
File history
Click on a date/time to view the file as it appeared at that time.
| Date/Time | Dimensions | User | Comment | |
|---|---|---|---|---|
| current | 00:44, 22 June 2007 | 1,431×731 (122 KB) | Gralo | ({{Information |Description=Greenhouse Gas Concentration Stabilization Level Scenario Categories. Self-drawn based on Figure SPM 8 in the ''IPCC Fourth Assessment Report, Working Group III, Summary for Policymakers.'' The text in the report reads:<br> "Sta) |