Image:GHG per capita 2000.svg
From Wikipedia, the free encyclopedia
GHG_per_capita_2000.svg (SVG file, nominally 940 × 477 pixels, file size: 1.98 MB)
| |
This is a file from the Wikimedia Commons. The description on its description page there is shown below. |
Summary
| Description |
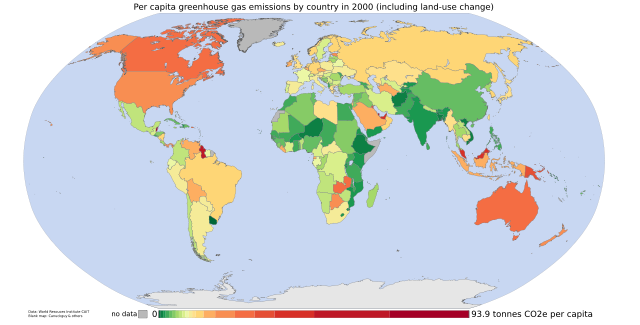
Greenhouse gas emissions per capita in 2000 Data from the World Resources Institute's CAIT 4.0 database (registration required). Includes CO2, CH4, N20, PFCs, HFCs and SF6. Estimates of the effects of land-use change are included; bunker-fuel emissions are not. The land-use estimates include the following (list from the relevant CAIT data note):
of forests in many tropical regions)
estimates include the emissions of carbon from wood products (burned, stored in longterm pools, decayed over time)
Also from the CAIT data note: "It is also important to note that the calculated flux of carbon does not explicitly include changes in carbon stocks that may result from various forms of management. Examples of what is not included are agricultural intensification, fertilization, the trend to no-till agriculture, thinning of forests, changes in species or varieties, and other silvicultural practices." And the data note warns that "these estimates of national sources and sinks of carbon from land-use change are uncertain on the order of +/- 150% for large fluxes, and +/- 50 MtC/yr for estimates near zero." So CAIT's land-use estimates are a bit wild. They are are, however, the best currently available at a national level. The world's wiseacres need the world's best data, else they are leaving themselves vulnerable to disappointment and disenchantment. Carbon dioxide from land-use change is at least as important a contributor to anthropogenic GHG emissions as the methane attributable to livestock-rearing - about a fifth of the total give or take a tenth in each case (with some overlaps). Those who would pronounce on global warming deserve a more complete picture of its causes than is currently offered almost everywhere - "greenhouse gas emissions" almost always means "carbon dioxide from the burning of fossil fuels". Burning fossil fuels is certainly most of the current story, but it's by no means the whole thing. Hence this map. |
|---|---|
| Source |
self-made using data from the World Resources Institute and a blank map by Canuckguy and others |
| Date |
03/9/07 |
| Author |
Vinny Burgoo |
| Permission ( Reusing this image) |
see below
|
Licensing
|

File history
Click on a date/time to view the file as it appeared at that time.
| Date/Time | Dimensions | User | Comment | |
|---|---|---|---|---|
| current | 20:32, 16 September 2007 | 940×477 (1.98 MB) | Vinny Burgoo | (3 or 4 countries in wrong colour band (incl China): corrected.) |
| 21:25, 31 August 2007 | 940×477 (1.98 MB) | Vinny Burgoo | (Per capita greenhouse gas emissions by country in 2000 including land-use change. The data was compiled by the World Resources Institute from several sources. I used Canuckguy's version of someone else's blank map. This update corrects the colour of the ) | |
| 23:54, 29 August 2007 | 940×477 (1.98 MB) | Vinny Burgoo | ({{Information |Description=Per capita greenhouse gas emissions by country (including land-use change) |Source=self-made |Date=30/8/07 |Author= Vinny Burgoo }} ) |