Image:Greenhouse Gas by Sector.png
From Wikipedia, the free encyclopedia
Size of this preview: 517 × 480 pixels
Full resolution (650 × 603 pixels, file size: 33 KB, MIME type: image/png)
Description
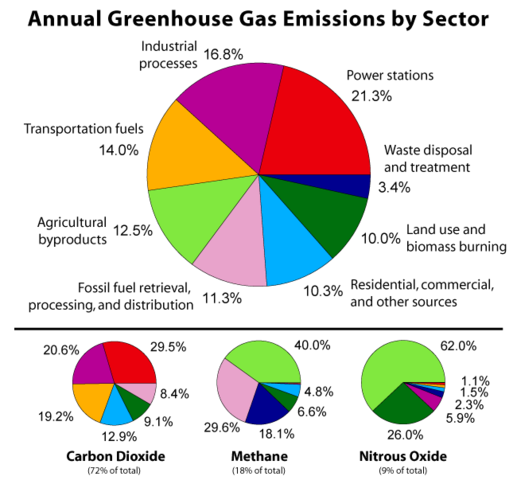
This figure shows the relative fraction of man-made greenhouse gases coming from each of eight categories of sources, as estimated by the Emission Database for Global Atmospheric Research version 3.2, fast track 2000 project . These values are intended to provide a snapshot of global annual greenhouse gas emissions in the year 2000.
The top panel shows the sum over all man-made greenhouse gases, weighted by their global warming potential over the next 100 years. This consists of 72% carbon dioxide, 18% methane, 9% nitrous oxide and 1% other gases. Lower panels show the comparable information for each of these three primary greenhouse gases, with the same coloring of sectors as used in the top chart. Segments with less than 1% fraction are not labeled.
Copyright
This figure was prepared by Robert A. Rohde from publicly available data and is part of the Global Warming Art project.
| Image from Global Warming Art This image is an original work created for Global Warming Art. Permission is granted to copy, distribute and/or modify this image under either:
Please refer to the image description page on Global Warming Art for more information |
| |
This graph image was uploaded in a raster image format such as PNG, GIF, or JPEG. However, it contains information that could be stored more efficiently and/or accurately in the SVG format, as a vector graphic. If possible, please upload an SVG version of this image. After doing so, please replace all instances of the previous version throughout Wikipedia (noted under the “File links” header), tag the old version with {{ Vector version available|NewImage.svg}}, and remove this tag. For more information, see Wikipedia:Preparing images for upload. For assistance with converting to SVG, please see the Graphics Lab. |
 |
| |
This image or media file may be available on the Wikimedia Commons as Image:Greenhouse Gas by Sector.png. The uploader requests that the local copy of this work not be deleted. |
|
| |
This file is an exact duplicate of another file from the Wikimedia Commons. Unless it is currently protected from editing, this media file may qualify for speedy deletion if it satisfies these conditions. | |
File history
Click on a date/time to view the file as it appeared at that time.
| Date/Time | Dimensions | User | Comment | |
|---|---|---|---|---|
| current | 08:25, 19 June 2006 | 650×603 (33 KB) | Dragons flight ( Talk | contribs) | ({{GWArt}}) |
See the setup instructions for more information.
File links
The following file is a duplicate of this file: