Image:Dewpoint.jpg
From Wikipedia, the free encyclopedia
No higher resolution available.
Dewpoint.jpg (400 × 400 pixels, file size: 28 KB, MIME type: image/jpeg)
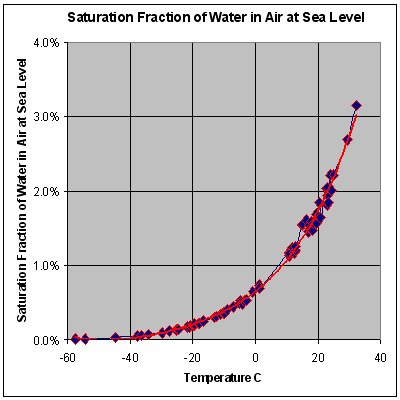
Graph of atmospheric dewpoints across a range of temperatures. I am the author of this figure. It was created on August 1, 2004 based on data from the NOAA weather balloon sounding database.
| |
This image was uploaded in the JPEG format even though it consists of non-photographic data. The information it contains could be stored more efficiently or more accurately in the PNG format or SVG format. If possible, please upload a PNG or SVG version of this image, derived from a non-JPEG source so that it doesn't contain any compression artifacts (or with existing artifacts removed) and with transparency where appropriate. After doing so, please replace all instances of the JPEG version throughout Wikipedia (noted under the "File links" header), tag the JPEG version with {{ obsolete|NewImage.ext}}, and remove this tag. For more information, see Wikipedia:Preparing images for upload. |
| |
Permission is granted to copy, distribute and/or modify this document under the terms of the GNU Free Documentation License, Version 1.2 or any later version published by the Free Software Foundation; with no Invariant Sections, no Front-Cover Texts, and no Back-Cover Texts. Subject to disclaimers. |
File history
Click on a date/time to view the file as it appeared at that time.
| Date/Time | Dimensions | User | Comment | |
|---|---|---|---|---|
| current | 16:33, 1 August 2004 | 400×400 (28 KB) | GregBenson ( Talk | contribs) | (Graph of atmospheric dewpoints across a range of temperatures. I am the author of this figure.) |
See the setup instructions for more information.
File links
The following pages on Schools Wikipedia link to this image (list may be incomplete):
Categories: Images with inappropriate JPEG compression