Image:AYool CCl4 history.png
From Wikipedia, the free encyclopedia
Size of this preview: 562 × 479 pixels
Full resolution (1,700 × 1,450 pixels, file size: 84 KB, MIME type: image/png)
Summary
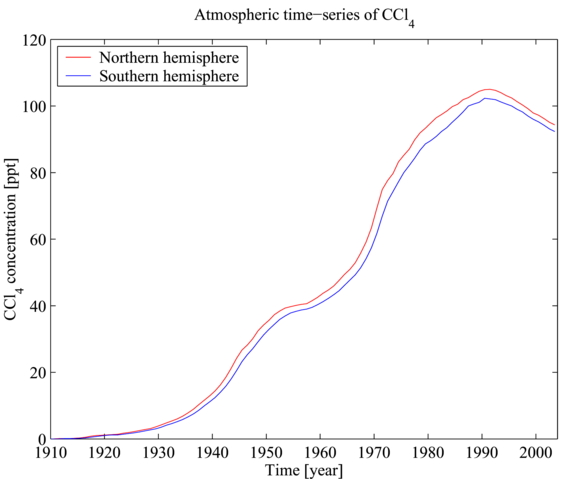
Time series of atmospheric concentrations of carbon tetrachloride from 1908 to 2003. Mixing ratio concentrations are shown for the northern and southern hemispheres, and are expressed as parts per trillion. The data are plotted here using MATLAB.
The published source of data for the figure is:
Walker, S. J., R. F. Weiss & P. K. Salameh (2000) Reconstructed histories of the annual mean atmospheric mole fractions for the halocarbons CFC-11, CFC-12, CFC-113 and carbon tetrachloride. Journal of Geophysical Research 105, 14285—14296.
The data (including error estimates and updates) are available online from the atmospheric halocarbon page at University of California, San Diego.
Licensing
|
File history
Click on a date/time to view the file as it appeared at that time.
| Date/Time | Dimensions | User | Comment | |
|---|---|---|---|---|
| current | 14:01, 22 March 2007 | 1,700×1,450 (84 KB) | Plumbago ( Talk | contribs) | ( Time series of atmospheric concentrations of carbon tetrachloride from 1908 to 2003. Mixing ratio concentrations are shown for the northern and southern hemispheres, and are expressed) |
See the setup instructions for more information.