Image:LogisticMap BifurcationDiagram.png
From Wikipedia, the free encyclopedia
Size of this preview: 640 × 453 pixels
Full resolution (1,838 × 1,300 pixels, file size: 571 KB, MIME type: image/png)
| |
This is a file from the Wikimedia Commons. The description on its description page there is shown below. |
Summary
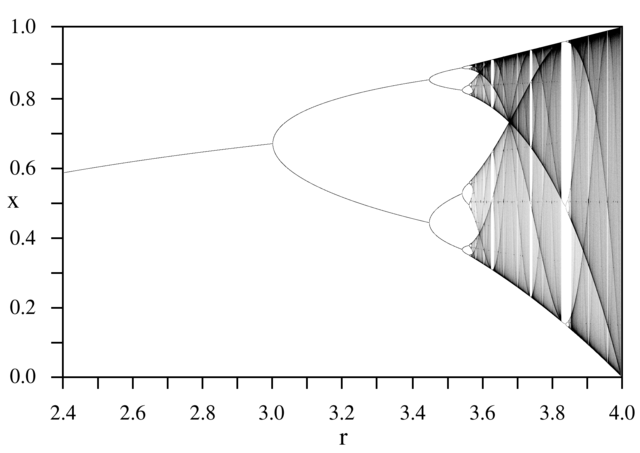
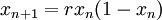
A bifurcation diagram for the Logistic map:
The horizontal axis is the r parameter, the vertical axis is the x variable. The image was created by forming a 1601 x 1001 array representing increments of 0.001 in r and x. A starting value of x=0.25 was used, and the map was iterated 1000 times in order to stabilize the values of x. 100,000 x -values were then calculated for each value of r and for each x value, the corresponding (x,r) pixel in the image was incremented by one. All values in a column (corresponding to a particular value of r) were then multiplied by the number of non-zero pixels in that column, in order to even out the intensities. Values above 250,000 were set to 250,000, and then the entire image was normalized to 0-255. Finally, pixels for values of r below 3.57 were darkened to increase visibility.
Licensing
 |
I, the copyright holder of this work, hereby release it into the public domain. This applies worldwide. In case this is not legally possible: Afrikaans | Alemannisch | Aragonés | العربية | Asturianu | Български | Català | Cebuano | Česky | Cymraeg | Dansk | Deutsch | Eʋegbe | Ελληνικά | English | Español | Esperanto | Euskara | Estremeñu | فارسی | Français | Galego | 한국어 | हिन्दी | Hrvatski | Ido | Bahasa Indonesia | Íslenska | Italiano | עברית | Kurdî / كوردی | Latina | Lietuvių | Latviešu | Magyar | Македонски | Bahasa Melayu | Nederlands | Norsk (bokmål) | Norsk (nynorsk) | 日本語 | Polski | Português | Ripoarisch | Română | Русский | Shqip | Slovenčina | Slovenščina | Српски / Srpski | Suomi | Svenska | ไทย | Tagalog | Türkçe | Українська | Tiếng Việt | Walon | 中文(简体) | 中文(繁體) | zh-yue-hant | +/- |
File history
Click on a date/time to view the file as it appeared at that time.
| Date/Time | Dimensions | User | Comment | |
|---|---|---|---|---|
| current | 00:11, 14 September 2005 | 1,838×1,300 (571 KB) | PAR | ( Bifurcation diagram for the logistic map for parameter r=2.4 to 4.0.) |