Image:Wave packet.svg
From Wikipedia, the free encyclopedia
Wave_packet.svg (SVG file, nominally 5,478 × 3,964 pixels, file size: 29 KB)
| |
This is a file from the Wikimedia Commons. The description on its description page there is shown below. |
| Description |
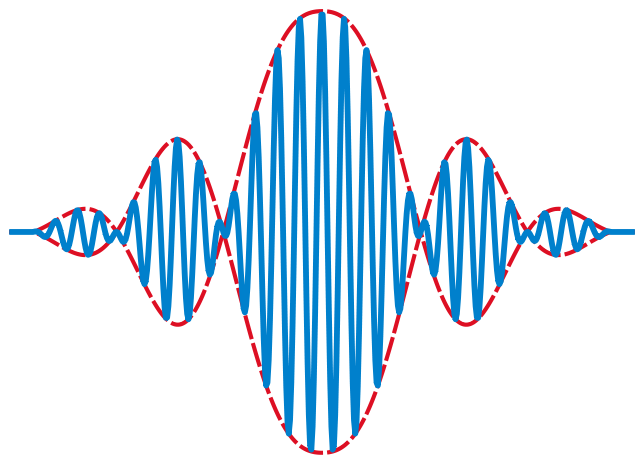
Illustration of a wave packet. |
|---|---|
| Source |
Self made, based on Image:Photon paquet onde.png. Released in the public domain. |
| Date |
06:28, 2 December 2007 (UTC) |
| Author |
Oleg Alexandrov |
| Permission ( Reusing this image) |
See below
|
 |
I, the copyright holder of this work, hereby release it into the public domain. This applies worldwide. In case this is not legally possible: Afrikaans | Alemannisch | Aragonés | العربية | Asturianu | Български | Català | Cebuano | Česky | Cymraeg | Dansk | Deutsch | Eʋegbe | Ελληνικά | English | Español | Esperanto | Euskara | Estremeñu | فارسی | Français | Galego | 한국어 | हिन्दी | Hrvatski | Ido | Bahasa Indonesia | Íslenska | Italiano | עברית | Kurdî / كوردی | Latina | Lietuvių | Latviešu | Magyar | Македонски | Bahasa Melayu | Nederlands | Norsk (bokmål) | Norsk (nynorsk) | 日本語 | Polski | Português | Ripoarisch | Română | Русский | Shqip | Slovenčina | Slovenščina | Српски / Srpski | Suomi | Svenska | ไทย | Tagalog | Türkçe | Українська | Tiếng Việt | Walon | 中文(简体) | 中文(繁體) | zh-yue-hant | +/- |
% Illustration of a wave packet

L = 1.7; % 2*L=length of domain
A = 1.2; % max amplitude

K = 1.3; % gaussian param
fast_wl = 52;
slow_wl = 4;

N = 500; % num of data points
lw = 40; % linewidth of curves

X = linspace(-L, L, N);
%Y = cos(X*slow_wl)./(1 + (X/K).^2);
q=1.5;
Y = A*cos(abs(X).^q*slow_wl).*exp(-K*X.^2);

num_P=1; % how many periods to keep
Y( find (abs(X) > ((2*num_P+0.5)*pi/slow_wl)^(1/q)) )=0;
Z = Y.*cos(fast_wl*X);

% KSmrq's colors
red    = [0.867 0.06 0.14];
blue   = [0, 129, 205]/256;
green  = [0, 200,  70]/256;
yellow = [254, 194,   0]/256;
white = 0.99*[1, 1, 1];
black = [0, 0, 0];

figure(1); clf; hold on; axis equal; axis off;
lw2=0.7*lw;
plot(X, Y, 'colour', red, 'linewidth', lw2, 'linestyle', '--')
plot(X, -Y, 'colour', red, 'linewidth', lw2, 'linestyle', '--')
plot(X, Z,  'colour', blue, 'linewidth', lw)

saveas(gcf, 'Wave_packet.eps', 'psc2') % save as eps
%plot2svg(Wave_packet.svg')             % save as svg  (need the svg package for that)
File history
Click on a date/time to view the file as it appeared at that time.
| Date/Time | Dimensions | User | Comment | |
|---|---|---|---|---|
| current | 06:40, 2 December 2007 | 5,478×3,964 (29 KB) | Oleg Alexandrov | (Tweak) |
| 06:38, 2 December 2007 | 200×200 (29 KB) | Oleg Alexandrov | ({{Information |Description=Illustration of a en:Wave packet |Source=Self made, released in the public domain |Date=~~~~~ |Author=~~~ |Permission=See below |other_versions= }} {{PD-self}} category:wave mechanics category:quantum mechanics [[) | |
| 06:28, 2 December 2007 | 200×200 (29 KB) | Oleg Alexandrov | ({{Information |Description=Illustration of a en:Wave packet |Source=Self made, released in the public domain |Date=~~~~~ |Author=~~~ |Permission=See below |other_versions= }} {{PD-self}} category:wave mechanics category:quantum mechanics [[) |