Image:Oxygenation-atm.png
From Wikipedia, the free encyclopedia
Size of this preview: 640 × 313 pixels
Full resolution (838 × 410 pixels, file size: 36 KB, MIME type: image/png)
| |
This is a file from the Wikimedia Commons. The description on its description page there is shown below. |
 |
This graph image should be recreated using vector graphics as an SVG file. This has several advantages; see Commons:Media for cleanup for more information. If an SVG form of this image is already available, please upload it. After uploading an SVG, replace this template with {{ vector version available|new image name.svg}}. |
|
العربية | Български | Català | Česky | Dansk | Deutsch | English | Esperanto | Español | Français | Galego | 한국어 | Italiano | Magyar | Lietuvių | Nederlands | 日本語 | Polski | Português | Română | Русский | Suomi | Svenska | Türkçe | Українська | 中文(繁體) | 中文(简体) | +/- |
|
Summary
| Description |
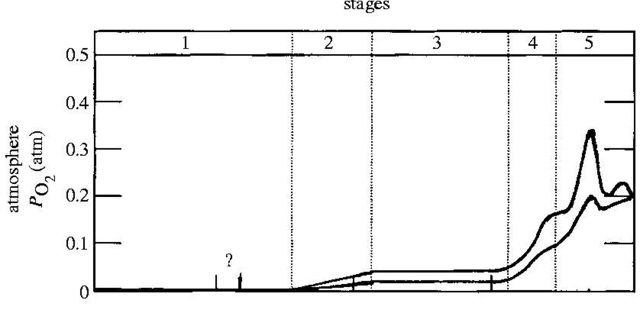
English: Estimated evolution of atmospheric
 and the concentration of O2 in the shallow and deep oceans. The stages are: stage 1 (3.85–2.45Gyr ago (Ga)), stage 2 (2.45–1.85Ga), stage 3 (1.85–0.85Ga), Stage 4 (0.85–0.54Ga )and stage 5 (0.54Ga–present) and the concentration of O2 in the shallow and deep oceans. The stages are: stage 1 (3.85–2.45Gyr ago (Ga)), stage 2 (2.45–1.85Ga), stage 3 (1.85–0.85Ga), Stage 4 (0.85–0.54Ga )and stage 5 (0.54Ga–present) |
|---|---|
| Source |
http://dx.doi.org/10.1098/rstb.2006.1838 figure 10 |
| Date |
June 29, 2006 |
| Author |
Heinrich D. Holland |
| Permission ( Reusing this image) |
I hereby grant Wikipedia the license under GFDL to use Figure 10 of my recent paper on the oxygenation of the atmosphere and oceans. |
| Other versions | Full figure at Image:Oxygenation.jpg |
Licensing
 |
Permission is granted to copy, distribute and/or modify this document under the terms of the GNU Free Documentation license, Version 1.2 or any later version published by the Free Software Foundation; with no Invariant Sections, no Front-Cover Texts, and no Back-Cover Texts. A copy of the license is included in the section entitled " GNU Free Documentation license". Aragonés | العربية | Asturianu | Беларуская (тарашкевіца) | Български | বাংলা | ইমার ঠার/বিষ্ণুপ্রিয়া মণিপুরী | Brezhoneg | Bosanski | Català | Cebuano | Česky | Dansk | Deutsch | Ελληνικά | English | Esperanto | Español | Eesti | Euskara | فارسی | Suomi | Français | Gaeilge | Galego | עברית | Hrvatski | Magyar | Bahasa Indonesia | Ido | Íslenska | Italiano | 日本語 | ქართული | ភាសាខ្មែរ | 한국어 | Kurdî / كوردی | Latina | Lëtzebuergesch | Lietuvių | Bahasa Melayu | Nnapulitano | Nederlands | Norsk (nynorsk) | Norsk (bokmål) | Occitan | Polski | Português | Română | Русский | Slovenčina | Slovenščina | Shqip | Српски / Srpski | Svenska | తెలుగు | ไทย | Tagalog | Türkçe | Українська | اردو | Tiếng Việt | Volapük | Yorùbá | 中文(简体) | 中文(繁體) | +/- |
File history
Click on a date/time to view the file as it appeared at that time.
| Date/Time | Dimensions | User | Comment | |
|---|---|---|---|---|
| current | 00:23, 24 December 2007 | 838×410 (36 KB) | Maveric149 | (== Summary == {{Information |Description=Estimated evolution of atmospheric <math>\ P_{{O_{{2}}}}</math> and the concentration of O<sub>2</sub> in the shallow and deep oceans |Source=http://dx.doi.org/10.1098/rstb.2006.1838 figure 10 |Date=June 29, 2006 ) |