Image:Ch4rug multicolor.jpg
From Wikipedia, the free encyclopedia
Size of this preview: 588 × 480 pixels
Full resolution (950 × 775 pixels, file size: 676 KB, MIME type: image/jpeg)
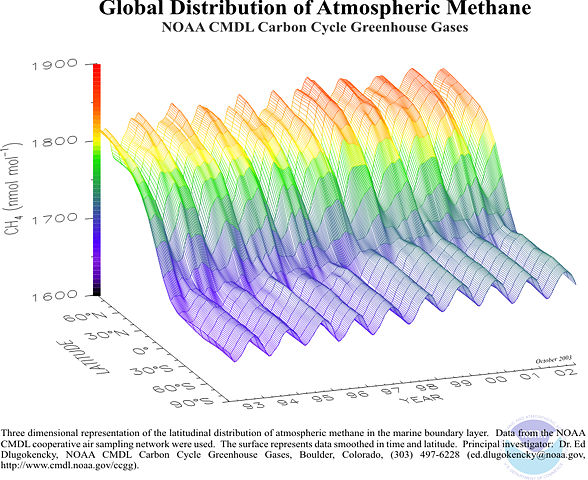
Author: Ed Dlugokencky, NOAA CMDL. http://www.cmdl.noaa.gov/albums/ccgg_figures/ch4rug_multicolor.jpg This plot show methane observations from 1993 to 2002 showing the growth of methane, the seasonal variations and the difference between northern and southern hemispheres.
 |
This image is in the public domain because it contains materials that originally came from the U.S. National Oceanic and Atmospheric Administration, taken or made during the course of an employee's official duties. |  |
| |
A PNG version of this image is also available, and should be used in place of this image whenever possible. If this is a fair-use image, please ensure the image has been replaced by the PNG version, and mark it for deletion by adding
For more information about the Portable Network Graphics format, see the article on PNG. |
File history
Click on a date/time to view the file as it appeared at that time.
| Date/Time | Dimensions | User | Comment | |
|---|---|---|---|---|
| current | 11:59, 22 January 2006 | 950×775 (676 KB) | NHSavage ( Talk | contribs) | (Author: Ed Dlugokencky, NOAA CMDL. http://www.cmdl.noaa.gov/albums/ccgg_figures/ch4rug_multicolor.jpg This plot show methane observations from 1993 to 2002 showing the growth of methane, the seasonal variations and the difference between northern and sout) |
See the setup instructions for more information.
File links
The following pages on Schools Wikipedia link to this image (list may be incomplete):
Categories: National Oceanic and Atmospheric Administration images | Images made obsolete by a PNG version