Image:Carbon cycle-cute diagram.jpeg
From Wikipedia, the free encyclopedia
No higher resolution available.
Carbon_cycle-cute_diagram.jpeg (540 × 417 pixels, file size: 52 KB, MIME type: image/jpeg)
| |
This is a file from the Wikimedia Commons. The description on its description page there is shown below. |
Summary
| Description |
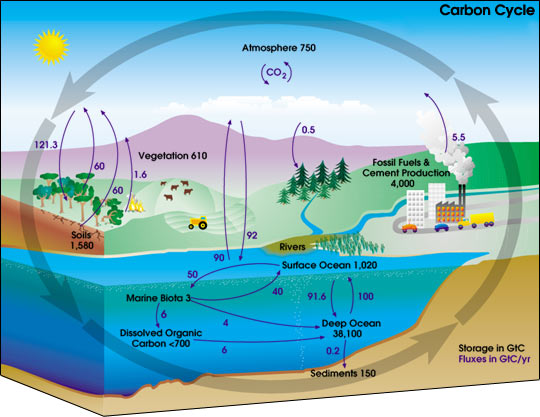
English: This carbon cycle diagram shows the storage and annual exchange of carbon between the atmosphere, hydrosphere and geosphere in gigatons - or billions of tons - of Carbon (GtC). Burning fossil fuels by people adds about 5.5 GtC of carbon per year into the atmosphere.
Deutsch: Diagramm des Kohlenstoffkreislaufes. Die schwarzen Zahlen zeigen wie viele Milliarden Tonnen Kohlenstoff (Gt C) in den verschiedenen Resevoiren vorhanden sind. Die blauen Zahlen zeigen an, wie viel Kohlenstoff zwischen den einzelnen Speichern pro Jahr ausgetauscht wird.
Español: Este esquema del ciclo del carbono muestra el almacenamiento y los cambios anuales del carbono entre la atmósfera, la hidrósfera y la geósfera en gigatones, o billones de toneladas, de carbono (GtC). La quema de conustibles fósiles libera cerca de 5.5 billones de toneladas de carbono al año en la atmósfera.
日本語: 炭素循環の概念図。黒の数値はそれぞれのリザーバーに存在する炭素量、青の数値はリザーバー間での年間の炭素の移動量。単位はギガt(10億トン)
Русский: Схема геохимического цикла углерода показывает количество углерода в атмосфере, гидросфере, и геосфере Земли, а также годовой перенос углерода между ними. Все величины в гигатоннах (миллиардах тонн). В результате сжигания ископаемого топлива, человечество ежегодно добавляет 5,5 гигатонн углерода в атмосферу.
|
|||||
|---|---|---|---|---|---|---|
| Source |
http://earthobservatory.nasa.gov/Library/CarbonCycle/carbon_cycle4.html |
|||||
| Date | ||||||
| Author |
User Kevin Saff on en.wikipedia |
|||||
| Permission ( Reusing this image) |
|
|||||
| Other versions |
Derivative works of this file: Originally from en.wikipedia; description page is (was) here * 20:01, 6 May 2004 [[:en:User:Kevin Saff|Kevin Saff]] 540×417 (53,453 bytes) <span class="comment">([[:en:Carbon cycle]], diagram with little cars and things.)</span> |
(Uploaded using CommonsHelper or PushForCommons)
Licensing
 |
This file is in the public domain because it was created by NASA. NASA copyright policy states that "NASA material is not protected by copyright unless noted". ( NASA copyright policy page or JPL Image Use Policy). Deutsch | English | Español | Français | Galego | Nederlands | Português | Русский | 中文(简体) | 中文(繁體) | +/- |
|
 |
Warnings:
|
 A vector version of this image (SVG) is available. For more information about vector graphics, read about Commons transition to SVG. Deutsch | English | Español | Français | Galego | עברית | Magyar | Italiano | 日本語 | 한국어 | Lietuvių | Polski | Português | Русский | Српски / Srpski | Українська | +/- |
 |
File history
Click on a date/time to view the file as it appeared at that time.
| Date/Time | Dimensions | User | Comment | |
|---|---|---|---|---|
| current | 15:16, 12 September 2006 | 540×417 (52 KB) | Giac83 | ({{Information| |Description= This en:carbon cycle diagram shows the storage and yearly changes of the carbon between the atmosphere, en:hydrosphere and en:geosphere in Gigatons - or billion tons - of Carbon (GtC).) |