Image:Historical copper price.png
From Wikipedia, the free encyclopedia

Size of this preview: 640 × 379 pixels
Full resolution (663 × 393 pixels, file size: 6 KB, MIME type: image/png)
| |
This is a file from the Wikimedia Commons. The description on its description page there is shown below. |
 |
This graph image should be recreated using vector graphics as an SVG file. This has several advantages; see Commons:Media for cleanup for more information. If an SVG form of this image is already available, please upload it. After uploading an SVG, replace this template with {{ vector version available|new image name.svg}}. |
|
العربية | Български | Català | Česky | Dansk | Deutsch | English | Esperanto | Español | Français | Galego | 한국어 | Italiano | Magyar | Lietuvių | Nederlands | 日本語 | Polski | Português | Română | Русский | Suomi | Svenska | Türkçe | Українська | 中文(繁體) | 中文(简体) | +/- |
|
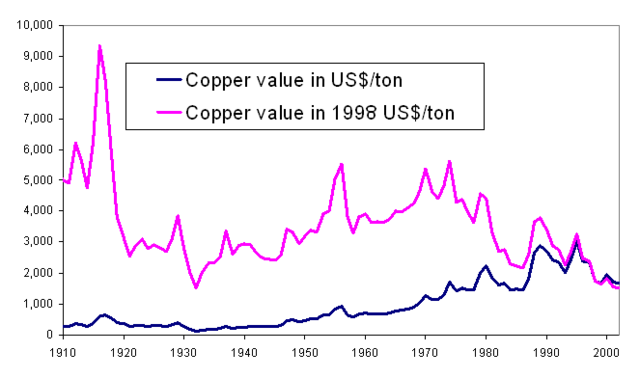
Historical copper price
Source: http://minerals.usgs.gov/ds/2005/140/copper.xls linked from http://minerals.usgs.gov/ds/2005/140/
|
data from source
Year       Estimated unit value ($/t)      Estimated unit value (98$/t)
1900           357                      7,000
1901           355                      7,000
1902           256                      4,800
1903           291                      5,300
1904           282                      5,100
1905           344                      6,300
1906           425                      7,700
1907           441                      7,700
1908           291                      5,300
1909           289                      5,300
1910           284                      5,000
1911           277                      4,900
1912           363                      6,200
1913           342                      5,630
1914           293                      4,760
1915           385                      6,180
1916           627                      9,360
1917           644                      8,190
1918           544                      5,890
1919           401                      3,780
1920           386                      3,140
1921           279                      2,540
1922           299                      2,900
1923           325                      3,100
1924           293                      2,790
1925           315                      2,920
1926           310                      2,840
1927           288                      2,690
1928           327                      3,110
1929           405                      3,850
1930           292                      2,860
1931           185                      1,980
1932           128                      1,520
1933           160                      2,020
1934           191                      2,330
1935           196                      2,330
1936           214                      2,520
1937           295                      3,350
1938           225                      2,610
1939           247                      2,900
1940           254                      2,960
1941           265                      2,930
1942           265                      2,650
1943           265                      2,500
1944           265                      2,450
1945           265                      2,410
1946           310                      2,580
1947           469                      3,420
1948           492                      3,320
1949           430                      2,940
1950           476                      3,210
1951           540                      3,400
1952           540                      3,310
1953           640                      3,910
1954           660                      4,000
1955           827                      5,040
1956           926                      5,540
1957           665                      3,840
1958           580                      3,280
1959           683                      3,820
1960           713                      3,920
1961           668                      3,630
1962           683                      3,670
1963           683                      3,640
1964           713                      3,750
1965           780                      4,020
1966           794                      3,990
1967           840                      4,100
1968           908                      4,260
1969           1,046                      4,649
1970           1,280                      5,375
1971           1,148                      4,623
1972           1,134                      4,420
1973           1,312                      4,811
1974           1,704                      5,631
1975           1,414                      4,285
1976           1,534                      4,393
1977           1,472                      3,960
1978           1,451                      3,625
1979           2,032                      4,565
1980           2,234                      4,419
1981           1,857                      3,328
1982           1,605                      2,711
1983           1,687                      2,761
1984           1,474                      2,313
1985           1,476                      2,238
1986           1,456                      2,165
1987           1,819                      2,609
1988           2,657                      3,662
1989           2,887                      3,797
1990           2,712                      3,383
1991           2,410                      2,885
1992           2,368                      2,751
1993           2,019                      2,278
1994           2,448                      2,692
1995           3,050                      3,262
1996           2,404                      2,498
1997           2,358                      2,395
1998           1,734                      1,734
1999           1,674                      1,638
2000           1,944                      1,841
2001           1,694                      1,559
2002           1,671                      1,514
File history
Click on a date/time to view the file as it appeared at that time.
| Date/Time | Dimensions | User | Comment | |
|---|---|---|---|---|
| current | 09:57, 20 November 2006 | 663×393 (6 KB) | Donarreiskoffer | (Historical copper price Source: http://minerals.usgs.gov/ds/2005/140/copper.xls linked from http://minerals.usgs.gov/ds/2005/140/ {{donarreiskoffer}} data: Year Est Est value value ($/t) 98$/t) 1900 357 7,000 1901 355 7,000 1902 2) |
