From Wikipedia, the free encyclopedia
 Size of this preview: 640 × 335 pixels
 Full resolution (758 × 397 pixels, file size: 6 KB, MIME type: image/png)
 |
This is a file from the Wikimedia Commons. The description on its description page there is shown below.Commons is a freely licensed media file repository. You can help.
|
Summary
| Description |
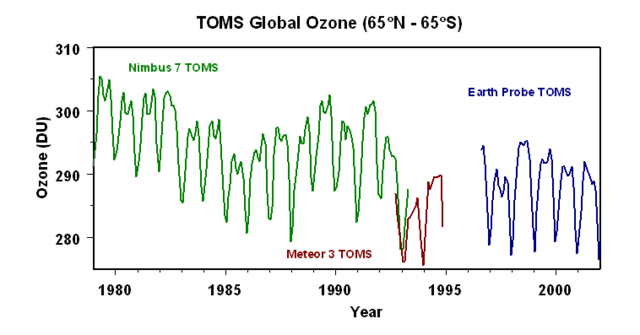
This image shows the global (from 65 degrees north latitude to 65 degrees south latitude) monthly average total ozone amount for the time period 1979 through the end of 2001. The green line shows the results from Nimbus-7 TOMS instrument. The red line shows the results from the Meteor-3 TOMS instrument. The blue line shows the results from the Earth Probe TOMS instrument, which developed a fault in 2002. |
| Source |
http://toms.gsfc.nasa.gov/multi/ozone_time_series.jpg |
| Date |
Friday, December 13, 2002 1:43:10 PM |
| Author |
NASA |
Permission
( Reusing this image) |
NASA material is not protected by copyright unless noted |
| Other versions |
wikipedia:Image:Ozone time series.jpg, which will soon be marked for deletion |
Licensing
|
|
This file is in the public domain because it was created by NASA. NASA copyright policy states that "NASA material is not protected by copyright unless noted". ( NASA copyright policy page or JPL Image Use Policy).
Deutsch | English | Español | Français | Galego | Nederlands | Português | Русский | 中文(简体) | 中文(繁體) | +/- |
|
|
|
Warnings:
- Use of NASA logos, insignia and emblems are restricted per US law 14 CFR 1221.
- The NASA website hosts a large number of images from the Soviet/ Russian space agency, and other non-American space agencies. These are not necessarily in the public domain.
- Materials from the Hubble Space Telescope may be copyrighted if they do not explicitly come from the STScI.
- All materials created by the SOHO probe are copyrighted and require permission for commercial non-educational use.
- Images featured on the Astronomy Picture of the Day (APOD) web site may be copyrighted.
|
File history
Click on a date/time to view the file as it appeared at that time.
|
|
Date/Time |
Dimensions |
User |
Comment |
| current |
12:24, 27 May 2006 |
758×397 (6 KB) |
Damian Yerrick |
|
File links
The following pages on Schools Wikipedia link to this image (list may be incomplete):


