From Wikipedia, the free encyclopedia
 Size of this preview: 346 × 479 pixels
 Full resolution (1,139 × 1,577 pixels, file size: 24 KB, MIME type: image/png)
 |
This is a file from the Wikimedia Commons. The description on its description page there is shown below.Commons is a freely licensed media file repository. You can help.
|
La bildo estas kopiita de wikipedia:en. La originala priskribo estas:
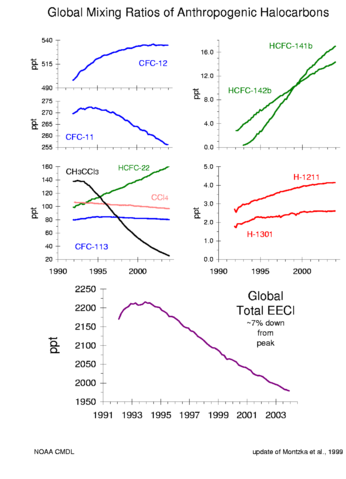
CFC gas trends and equivalent chlorine effect.
Combined chlorine and bromine in the lower stratosphere (10-25 km), where most ozone loss occurs, leveled off around 1999. Bromine is included as an ozone-depleting chemical because although it is not as abundant as chlorine, it is 45 times more effective per atom in destroying stratospheric ozone. Earlier measurements showed that the peak of equivalent chlorine (chlorine + 45 times bromine) had already occurred at the surface between mid- 1992 and mid- 1994.[CMDL20010206]
The observed decrease is driven by a large and rapid decline in methyl bromide, a brominated gas that is regulated internationally by the Montreal Protocol. It is larger than that expected from model calculations as given in the WMO/UNEP 2002 Scientific Assessment to Ozone Depletion.[CMDL20030815][CMDL27hats5]
Related images
References
- ^ Template:Web reference
- ^ Template:Web reference
- ^ Template:Web reference
Source
 |
This image is in the public domain because it contains materials that originally came from the U.S. National Oceanic and Atmospheric Administration, taken or made during the course of an employee's official duties. |
|
Source: ftp://140.172.192.211/hats/Total_Cl_Br/totCl_2004.ps from CMDL Data Archive: http://www.cmdl.noaa.gov/info/ftpdata.html
| date/time |
username |
edit summary |
| 20:44, 9 June 2005 |
en:User:SEWilco |
(<span class="autocomment"><a href="/wiki/Image:Ozone_cfc_trends.png#References" title="Image:Ozone cfc trends.png">→</a>References -</span> more complete version) |
| 21:16, 2 April 2005 |
en:User:SEWilco |
(link to 3rd reference) |
| 15:34, 2 April 2005 |
en:User:Mozzerati |
(<span class="autocomment"><a href="/wiki/Image:Ozone_cfc_trends.png#References" title="Image:Ozone cfc trends.png">→</a>References -</span> make into numbered list, but what's the last reference? It's not used? See <a href="/wiki/Wikipedia:Footnote3" title="Wikipedia:Footnote3">Wikipedia:Footnote3</a>) |
| 15:33, 2 April 2005 |
en:User:Mozzerati |
(update {{endnote| template to be {{note| according to recent consensus. See <a href="/wiki/Wikipedia:Footnote3" title="Wikipedia:Footnote3">Wikipedia:Footnote3</a> and talk page.) |
| 06:32, 18 March 2005 |
en:User:SEWilco |
(updates) |
| 05:33, 18 March 2005 |
en:User:SEWilco |
(updates) |
| 05:11, 18 March 2005 |
en:User:SEWilco |
(CFC gas trends. ==Related images== <gallery> Image:Major greenhouse gas trends.png|Greenhouse gas trends </gallery> ==Source== {{PD-USGov-DOC-NOAA}} Source: http://www.cmdl.noaa.gov/hats/graphs/graphs.html or ftp://ftp.cmdl.noaa.gov/hats/graphs/) |
File history
Click on a date/time to view the file as it appeared at that time.
|
|
Date/Time |
Dimensions |
User |
Comment |
| current |
19:38, 15 January 2006 |
1,139×1,577 (24 KB) |
Maksim |
|
File links
The following pages on Schools Wikipedia link to this image (list may be incomplete):


