Image:Polar Bear Habitat.png
From Wikipedia, the free encyclopedia
Size of this preview: 536 × 480 pixels
Full resolution (610 × 546 pixels, file size: 423 KB, MIME type: image/png)
| |
This is a file from the Wikimedia Commons. The description on its description page there is shown below. |
Summary
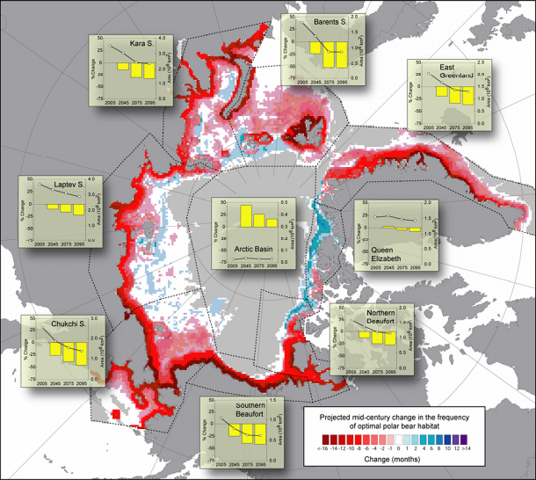
| Description |
Projected changes (based on 10 IPCC AR-4 GCM models run with the SRES- A1B forcing scenario) in the spatial distribution and integrated annual area of optimal polar bear habitat. Base map shows the cumulative number of months per decade where optimal polar bear habitat was either lost (red) or gained (blue) from 2001–2010 to 2041–2050. Offshore gray shading denotes areas where optimal habitat was absent in both periods. Insets show the average annual ( 12 months) cumulative area of optimal habitat (right y-axis, line plot) for four 10-year periods in the 21st century (x-axis midpoints), and their associated percent change in area (left y axis, histograms) relative to the first decade (2001–2010). |
|---|---|
| Source |
[ http://www.usgs.gov/newsroom/special/polar_bears/docs/USGS_PolarBear_Durner_Habitat_highres.pdf |
| Date | |
| Author |
USGS |
| Permission ( Reusing this image) |
see below
|
Licensing
 |
This work is in the public domain in the United States because it is a work of the United States Federal Government under the terms of Title 17, Chapter 1, Section 105 of the US Code. See Copyright. Note: This only applies to works of the Federal Government and not to the work of any individual U.S. state, territory, commonwealth, county, municipality, or any other subdivision. This template also does not apply to postage stamp designs published by the United States Postal Service since 1978. (See 206.02(b) of Compendium II: Copyright Office Practices). العربية | Български | Česky | Deutsch | English | Español | Français | Magyar | Italiano | 日本語 | 한국어 | Polski | Português | 中文(繁體) | 中文(简体) | +/- |
 |
| |
This media file is uncategorized. Please help improve this media file by adding it to one or more categories, so it may be associated with related media files ( how?), and so that it can be more easily found. Please notify the uploader with
Deutsch | English | Español | Français | Italiano | 日本語 | 한국어 | Português | Svenska | +/- |
File history
Click on a date/time to view the file as it appeared at that time.
| Date/Time | Thumbnail | Dimensions | User | Comment | |
|---|---|---|---|---|---|
| current | 22:46, 30 November 2007 |  |
610×546 (423 KB) | Sagredo | ({{Information |Description=Projected changes (based on 10 IPCC AR-4 GCM models run with the SRES- A1B forcing scenario) in the spatial distribution and integrated annual area of optimal polar bear habitat. Base map shows the cumulative number of months) |