Image:Energy thru phase changes.jpg
From Wikipedia, the free encyclopedia
Size of this preview: 640 × 413 pixels
Full resolution (960 × 620 pixels, file size: 216 KB, MIME type: image/jpeg)
Summary
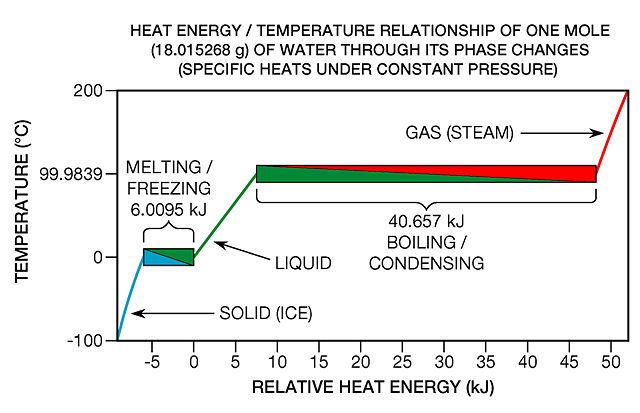
This graph shows how water’s temperature does not change during phase transitions as heat energy flows in or out of it.
By Greg L 00:16, 20 July 2006 (UTC)
Licensing
| |
I, the creator of this work, hereby grant the permission to copy, distribute and/or modify this document under the terms of the GNU Free Documentation License, Version 1.2 or any later version published by the Free Software Foundation; with no Invariant Sections, no Front-Cover Texts, and no Back-Cover Texts. Subject to disclaimers. |
| |
A PNG version of this image is also available, and should be used in place of this image whenever possible. If this is a fair-use image, please ensure the image has been replaced by the PNG version, and mark it for deletion by adding
For more information about the Portable Network Graphics format, see the article on PNG. |
File history
Click on a date/time to view the file as it appeared at that time.
| Date/Time | Dimensions | User | Comment | |
|---|---|---|---|---|
| current | 00:16, 20 July 2006 | 960×620 (216 KB) | Greg L ( Talk | contribs) | (This graph shows how water’s temperature does not change during phase transitions as heat energy flows in or out of it.<br><br>By ~~~~) |
See the setup instructions for more information.
File links
The following file is a duplicate of this file:
The following pages on Schools Wikipedia link to this image (list may be incomplete):
Metadata
This file contains additional information, probably added from the digital camera or scanner used to create or digitize it. If the file has been modified from its original state, some details may not fully reflect the modified file.
| Orientation | Normal |
|---|---|
| Horizontal resolution | 72 dpi |
| Vertical resolution | 72 dpi |
| Software used | Adobe Photoshop 7.0 |
| File change date and time | 17:06, 19 July 2006 |
| Colour space | 65535 |
Categories: Self-published work | Images made obsolete by a PNG version