Image:Economics of Moore's Law.JPG
From Wikipedia, the free encyclopedia
Size of this preview: 589 × 479 pixels
Full resolution (640 × 521 pixels, file size: 31 KB, MIME type: image/jpeg)
Summary
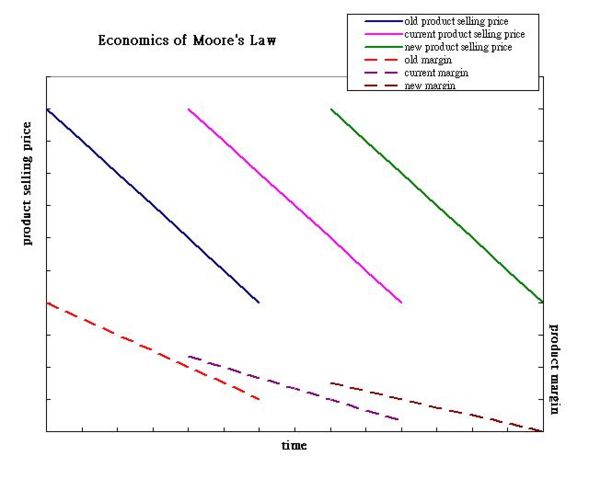
Graph showing the economic impact of rising manufacturing costs with each product generation. For each product generation, the introductory price is high, but the starting level is assumed not to change. Over time, as newer products are introduced, the price of the existing product(s) must drop. However, the manufacturing costs of each product doesn't change. Furthermore, newer products are more expensive to make (due to process complexity, new materials consumed, etc.). Thus, the product margins are expected to decrease, as indicated by the dashed curves.
Licensing:
|
File history
Click on a date/time to view the file as it appeared at that time.
| Date/Time | Dimensions | User | Comment | |
|---|---|---|---|---|
| current | 06:37, 24 March 2008 | 640×521 (31 KB) | Guiding light ( Talk | contribs) | |
| revert | 06:26, 24 March 2008 | 640×521 (31 KB) | Guiding light ( Talk | contribs) | (Graph showing the economic impact of rising manufacturing costs with each product generation. For each product generation, the introductory price is high, but the starting level is assumed not to change. Over time, as newer products are introduced, the pr) |
See the setup instructions for more information.
File links
The following pages on Schools Wikipedia link to this image (list may be incomplete):
Categories: Cc-by-sa-3.0,2.5,2.0,1.0 images | GFDL images | Self-published work