Image:WMAP 3yr EE.png
From Wikipedia, the free encyclopedia
Size of this preview: 559 × 480 pixels
Full resolution (853 × 732 pixels, file size: 18 KB, MIME type: image/png)
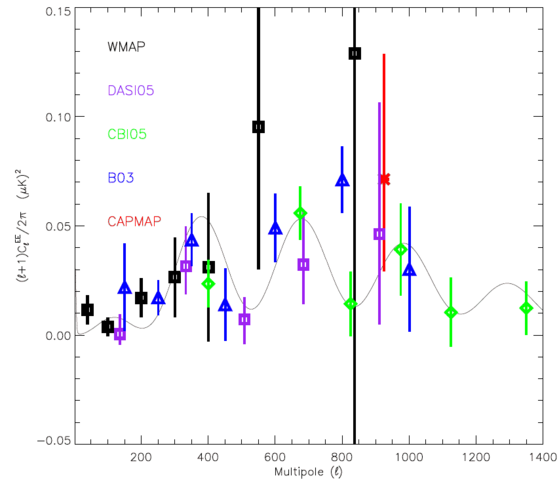
WMAP three-year polarization (EE) spectrum.
Taken from L. Page et al. (WMAP collaboration), "Three-year Wilkinson Microwave Anisotropy Probe (WMAP) observations: polarization analysis" figure 22 (preprint available from ) with caption that reads "The EE spectrum at l > 40 for all measurements of the CMB polarization. The curve is the best fit EE spectrum. Note that the y axis has only one power of l. The black boxes are the WMAP data; the triangles are the BOOMERanG data; the squares are the DASI data; the diamonds are the CBI data; and the asterisk is the CAPMAP data. The WMAP data are the QVW combination. For the first point, the cleaned value is used. For other values, the raw values are used."
 |
This file is in the public domain because it was created by NASA. NASA copyright policy states that "NASA material is not protected by copyright unless noted". ( NASA copyright policy page or JPL Image Use Policy)
|
File history
Click on a date/time to view the file as it appeared at that time.
| Date/Time | Dimensions | User | Comment | |
|---|---|---|---|---|
| current | 00:00, 19 March 2006 | 853×732 (18 KB) | Joke137 ( Talk | contribs) | (WMAP three-year polarization (EE) spectrum. Taken from L. Page ''et al.'' (WMAP collaboration), "Three-year Wilkinson Microwave Anisotropy Probe (WMAP) observations: polarization analysis" figure 22 (preprint available from [http://lambda.gsfc.nasa.gov/p) |
See the setup instructions for more information.