Image:Percentage living on less than $1 per day 1981-2001.png
From Wikipedia, the free encyclopedia
Size of this preview: 537 × 480 pixels
Full resolution (733 × 655 pixels, file size: 21 KB, MIME type: image/png)
Summary
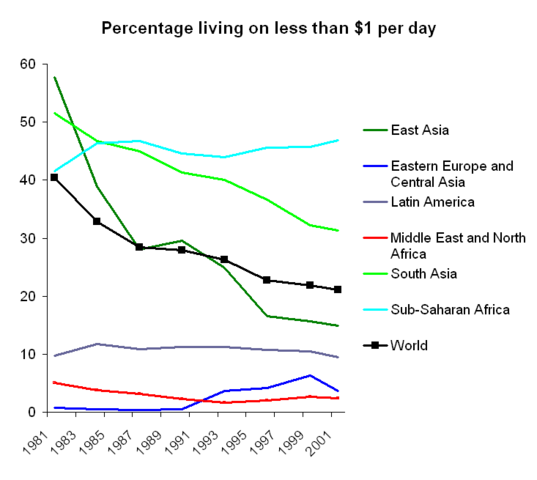
Chart showing the percentage of the population living on less than $1 per day 1981-2001. It excludes data for North America.
Based on US$1.08 in 1993 Purchasing Power Parity (PPP), and then adjusted for country-specific inflation.
Data source: "How Have the World's Poorest Fared Since the Early 1980s?" by Shaohua Chen and Martin Ravallion. Table 3, p. 28.
Licensing
 |
I, the copyright holder of this work, hereby release it into the public domain. This applies worldwide. In case this is not legally possible, |
File history
Click on a date/time to view the file as it appeared at that time.
| Date/Time | Thumbnail | Dimensions | User | Comment | |
|---|---|---|---|---|---|
| current | 20:40, 29 December 2006 |  |
733×655 (21 KB) | Bungopolis ( Talk | contribs) | (correct "East Asida" to "East Asia" and removed small artifact) |
| revert | 22:14, 13 September 2006 |  |
733×655 (23 KB) | Ultramarine ( Talk | contribs) | (Data source: "How Have the World's Poorest Fared Since the Early 1980s?" by Shaohua Chen and Martin Ravallion. http://econ.worldbank.org/external/default/main?ImgPagePK=64202990&entityID=000112742_20040722172047&menuPK=64168175&pagePK=64210502&theSitePK=4) |
See the setup instructions for more information.
File links
The following pages on Schools Wikipedia link to this image (list may be incomplete):
Categories: User-created public domain images | Income distribution