From Wikipedia, the free encyclopedia
 |
This is a file from the Wikimedia Commons. The description on its description page there is shown below.Commons is a freely licensed media file repository. You can help.
|
Summary
| Description |
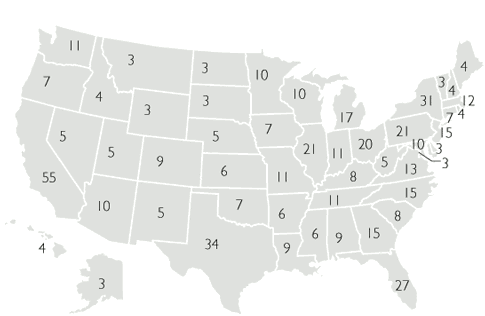
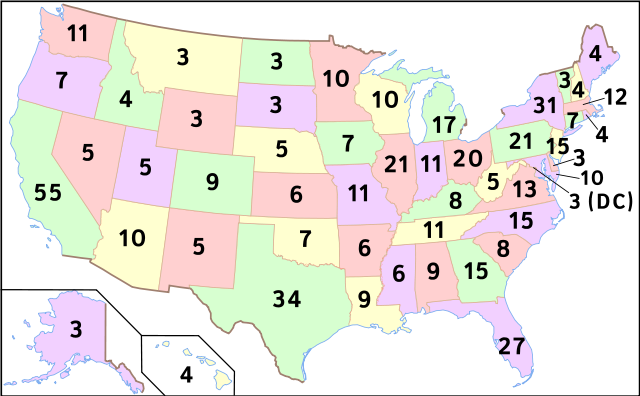
Map of number of electoral votes by state after redistricting from the 2000 census. Modified by User:Theshibboleth for the font to be consistent with electoral maps. Edited with Inkscape. Reuploaded by User:King of Hearts to correct spelling (vs. Image:Electorial map.svg). |
| Source |
Self-made by User:Scott5114, based on Image:Map of USA with state names.svg. |
| Date |
April 18, 2006 |
| Author |
User:Scott5114 |
Permission
( Reusing this image) |
Public domain; use for any purpose. |
| Other versions |
 |
Licensing
 |
This image has been released into the public domain by its author, Scott5114. This applies worldwide.
In some countries this may not be legally possible; if so:
Scott5114 grants anyone the right to use this work for any purpose, without any conditions, unless such conditions are required by law.
العربية | Български | Deutsch | Ελληνικά | English | Español | Français | Italiano | 日本語 | 한국어 | Polski | Русский | Српски / Srpski | Svenska | தமிழ் | Українська | 中文(繁體) | 中文(简体) +/- |
There are 54 votes for California not 55
- No, there are 55, as the map states. See for confirmation. Superm401 01:11, 21 December 2007 (UTC)
File history
Click on a date/time to view the file as it appeared at that time.
|
|
Date/Time |
Dimensions |
User |
Comment |
| current |
15:17, 23 May 2007 |
959×593 (482 KB) |
King of Hearts |
|
File links
The following pages on Schools Wikipedia link to this image (list may be incomplete):


