Demographics of Europe
2008/9 Schools Wikipedia Selection. Related subjects: European Geography
The demographics of Europe refers to the demography of the population that inhabits the European continent. This pertains mainly to the changing number and composition of the population of Europe. Since the Renaissance, Europe has had a dominating influence in culture, economics and social movements in the world. European demography is important not only historically, but also in understanding current international relations and population issues.
Some current and past issues in European demography have included religious emigration, race relations, economic immigration, a declining birth rate and an ageing population. In some countries, such as the Republic of Ireland and Poland, access to abortion is currently limited; in the past, such restrictions and also restrictions on artificial birth control were commonplace throughout Europe. Furthermore, two European countries (currently The Netherlands and Switzerland) have allowed a limited form of voluntary euthanasia. It remains to be seen how much demographic impact this may have.
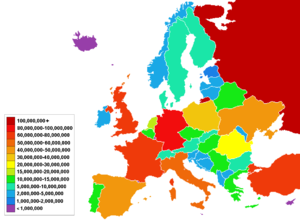
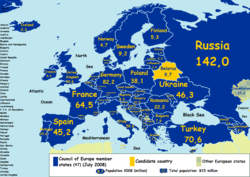
In 2005 the population of Europe was estimated to be 728 million according to the United Nations, which is slightly more than one-ninth of the world's population. A century ago, Europe had nearly a quarter of the world's population. The population of Europe has grown in the past century, but in other areas of the world (in particular Africa and Asia) the population has grown far more quickly. In 2005 the EU had an overall net gain from immigration of 1.8 million people, despite having one of the highest population densities in the world. This accounted for almost 85% of Europe's total population growth. According to UN population projection (medium variant), Europe's share will fall to 7% in 2050, numbering 653 million.
Total population
In 2005, the population of Europe was 728 million or 11% of the world population. It has been growing from 500 million after World War II, peaked in the early 2000s at more than 700 million and has since then begun a decline.
| Year | Population in thousands |
|---|---|
| 1950 | 547,405 |
| 1960 | 604,406 |
| 1970 | 655,862 |
| 1980 | 692,435 |
| 1990 | 721,390 |
| 2000 | 728,463 |
| 2005 | 728,389 |
| 2010 | 725,786 |
| 2020 | 714,959 |
| 2030 | 698,140 |
| 2040 | 677,191 |
| 2050 | 653,323 |
Regions
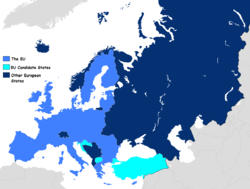
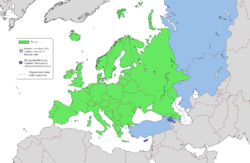
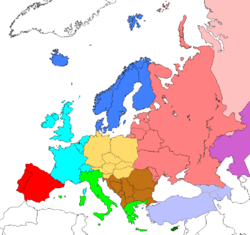
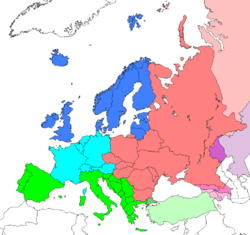
According to different definitions, such as consideration of the concept of Central Europe, the following territories and regions may be subject to various other categorisations.
| Name of region and territory, with flag |
Area (km²) |
Population (1 July, 2002 est.) |
Population density (per km²) |
Capital |
|---|---|---|---|---|
| 1,552 | 26,008 | 16.8 | Mariehamn | |
| 28,748 | 3,600,523 | 125.2 | Tirana | |
| 468 | 68,403 | 146.2 | Andorra la Vella | |
| 83,858 | 8,169,929 | 97.4 | Vienna | |
| 29,800 | 3,229,900 | 101 | Yerevan | |
| 86,600 | 8,621,000 | 97 | Baku | |
| 207,600 | 10,335,382 | 49.8 | Minsk | |
| 30,510 | 10,274,595 | 336.8 | Brussels | |
| 51,129 | 4,448,500 | 77.5 | Sarajevo | |
| 110,910 | 7,621,337 | 68.7 | Sofia | |
| 56,542 | 4,437,460 | 77.7 | Zagreb | |
| 9,251 | 788,457 | 85 | Nicosia | |
| 78,866 | 10,256,760 | 130.1 | Prague | |
| 43,094 | 5,368,854 | 124.6 | Copenhagen | |
| 45,226 | 1,415,681 | 31.3 | Tallinn | |
| 1,399 | 46,011 | 32.9 | Tórshavn | |
| 336,593 | 5,157,537 | 15.3 | Helsinki | |
| 547,030 | 59,765,983 | 109.3 | Paris | |
| 69,700 | 4,661,473 | 64 | Tbilisi | |
| 357,021 | 83,251,851 | 233.2 | Berlin | |
| 5.9 | 27,714 | 4,697.3 | Gibraltar | |
| 131,940 | 10,645,343 | 80.7 | Athens | |
| 78 | 64,587 | 828.0 | St. Peter Port | |
| 93,030 | 10,075,034 | 108.3 | Budapest | |
| 103,000 | 307,261 | 2.7 | Reykjavík | |
| 70,280 | 4,234,925 | 60.3 | Dublin | |
| 572 | 73,873 | 129.1 | Douglas | |
| 301,230 | 58,751,711 | 191.6 | Rome | |
| 116 | 89,775 | 773.9 | Saint Helier | |
| 2,724,900 | 15,217,711 | 5.6 | Astana | |
| 10,887 | 2,126,708 | 220 | Pristina | |
| 64,589 | 2,366,515 | 36.6 | Riga | |
| 160 | 32,842 | 205.3 | Vaduz | |
| 65,200 | 3,601,138 | 55.2 | Vilnius | |
| 2,586 | 448,569 | 173.5 | Luxembourg | |
| 25,333 | 2,054,800 | 81.1 | Skopje | |
| 316 | 397,499 | 1,257.9 | Valletta | |
| 33,843 | 4,434,547 | 131.0 | Chişinău | |
| 1.95 | 31,987 | 16,403.6 | Monaco | |
| 13,812 | 616,258 | 44.6 | Podgorica | |
| 41,526 | 16,318,199 | 393.0 | Amsterdam | |
| 324,220 | 4,525,116 | 14.0 | Oslo | |
| 312,685 | 38,625,478 | 123.5 | Warsaw | |
| 91,568 | 10,409,995 | 110.1 | Lisbon | |
| 238,391 | 21,698,181 | 91.0 | Bucharest | |
| 17,075,400 | 142,200,000 | 26.8 | Moscow | |
| 61 | 27,730 | 454.6 | San Marino | |
| 88,361 | 9,663,742 | 109.4 | Belgrade | |
| 48,845 | 5,422,366 | 111.0 | Bratislava | |
| 20,273 | 1,932,917 | 95.3 | Ljubljana | |
| 504,851 | 45,061,274 | 89.3 | Madrid | |
Mayen Islands (Norway) |
62,049 | 2,868 | 0.046 | Longyearbyen |
| 449,964 | 9,090,113 | 19.7 | Stockholm | |
| 41,290 | 7,507,000 | 176.8 | Bern | |
| 783,562 | 70,586,256 | 93 | Ankara | |
| 603,700 | 48,396,470 | 80.2 | Kiev | |
| 244,820 | 61,100,835 | 244.2 | London | |
| 0.44 | 900 | 2,045.5 | Vatican City | |
| Total | 10,180,000 | 731,000,000 | 70 |
Age
Perhaps mirroring its declining population growth, European countries tend to have older populations overall. European countries had nine of the top ten highest median ages in national populations in 2005. Only Japan had an older population.
Religion
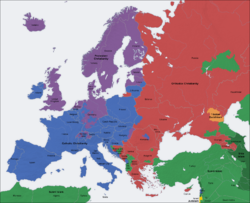
Religion in Europe spans approximately 10,000 years of human settlement on the continent. It has developed from the earliest prehistoric spirituality via the Ancient Greek, Roman and Nordic faiths to the spread of the Abrahamic religions of Christianity, Judaism and Islam. Europe has a rich and diverse religious history, and its various faiths have been a major influence on European art, culture, philosophy and law. In modern times, the overwhelming majority of religious Europeans are Christian; the second-largest religion in Europe is Islam, followed by Judaism. Europe also has the largest number and proportion of agnostics and atheists in the Western world.
Nationality
Language
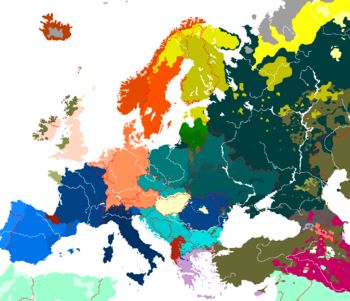
Europe has 30-40 major languages depending on definition. The European Union (EU), which currently excludes Norway and many eastern European countries, recognises 23 official languages as of 2007. According to the same source, the seven most natively spoken languages in the EU are (percentage of total European population):
These figures change slightly when foreign language skills are taken into account. The list below shows the top eight European languages ordered by total number of speakers in the EU:
- 51% English
- 33% German
- 28% French
- 16% Italian
- 15% Spanish
- 10% Polish
- 7% Russian
- 6% Dutch
This makes German the most frequently spoken native language and English the most frequently second spoken language overall in the European Union, with German the second-most common language overall.
Foreign language skills
Luxembourg, the Netherlands, Denmark, Malta, Sweden, Slovenia, Belgium, and Finland are the EU countries with the most foreign language skills. This refers to all foreign languages. English is spoken most frequently in Malta, Sweden, Denmark, and the Netherlands. The largest countries in Europe have the following percentages of English language skills: 44% Germany, 32% France, 28% Italy, 22% Poland, 18% Spain. The countries with the least foreign language skills are the UK, Ireland, Italy and Spain.
Extinct and endangered languages
Many languages have become extinct in Europe and the process is continuing. Languages that are already rated as extinct by the UNESCO Red Book include Old Prussian, Cornish, and two Jewish languages. Nearly extinct and seriously endangered languages include several Sami, Frisian, and regional Jewish languages, Tsakonian and Breton.
Ethnicity
There are indigenous ethnic groups, as well as immigrant groups (ranging from Black Europeans to Asian Europeans).
Genetic origins
Homo sapiens appears in Europe some 40,000 years ago, with the Cro magnon settlement. Over the prehistoric period there was continual immigration to Europe, notably with the neolithic revolution.
The vast majority of Europe’s inhabitants are of the European (or Caucasoid) geographic race, characterized by white or lightly pigmented skins and variability in eye and hair colour and by a number of biochemical similarities. .
Genetically, the main substructure within European populations is between the Atlantic ("Basque"), the Balkans (" Near East") and the Northern (" Finnic") poles. The main components in the European genomes appear to derive from ancestors whose features were similar to those of modern Basques and Near Easterners. The lowest degree of either Basque or Near Eastern admixture is found in Finland, whereas the highest values are, respectively, 70% ("Basque") in Spain and more than 60% ("Near Eastern") in the Balkans.
A 2007 study using samples exclusively from Europe found an unusually high degree of European homogeneity: "there is low apparent diversity in Europe with the entire continent-wide samples only marginally more dispersed than single population samples elsewhere in the world." The main component of genetic differentiation in Europe was found to occur on a line from the north to the south-east ( northern Europe to the Balkans), with another east-west axis of differentiation across Europe.
