Image:Carbon14-sunspot.svg
From Wikipedia, the free encyclopedia

Carbon14-sunspot.svg (SVG file, nominally 1,052 × 600 pixels, file size: 334 KB)
Summary
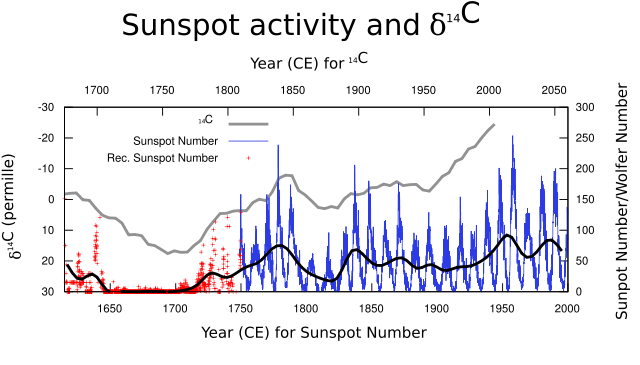
Correlations between 14C and sunspot activity. There is a roughly 60 year delay between changes in sunspot activity and 14C; in this chart the time scale for 14C has been separated (labelled at the top of the chart) and offset by 60 years. Note that the 14C record since 1950 has been distorted by nuclear testing. Sunspot data in red is reconstructed from group sunspot numbers.
Template:Vertical alignment for 14C is correct in my editor, corrections for Wikipedia rendering are welcome
Licensing
This figure was produced by Leland McInnes using gnuplot and Inkscape and is licensed under the GFDL. All data is from publicly available sources.
 |
I, the creator of this work, hereby grant the permission to copy, distribute and/or modify this document under the terms of the GNU Free Documentation License, Version 1.2 or any later version published by the Free Software Foundation; with no Invariant Sections, no Front-Cover Texts, and no Back-Cover Texts. Subject to disclaimers. |
Data Sources
- (gray) Carbon 14 data: http://www.radiocarbon.org/IntCal04%20files/intcal04.14c
- (blue) Sunspot data: http://sidc.oma.be/DATA/monthssn.dat
- (red) Reconstructed Sunspot Data: ftp://ftp.ngdc.noaa.gov/STP/SOLAR_DATA/SUNSPOT_NUMBERS/GROUP_SUNSPOT_NUMBERS/monthrg.dat
File history
Click on a date/time to view the file as it appeared at that time.
| Date/Time | Dimensions | User | Comment | |
|---|---|---|---|---|
| current | 22:57, 21 November 2006 | 1,052×600 (334 KB) | Leland McInnes ( Talk | contribs) | (Correlations between <sup>14</sup>C and sunspot activity. There is a roughly 60 year delay between changes in sunspot activity and <sup>14</sup>C; in this chart the time scale for <sup>14</sup>C has been separated (labelled at the top of the chart) and of) |
See the setup instructions for more information.