Image:NumInt-MC.png
From Wikipedia, the free encyclopedia
Size of this preview: 640 × 480 pixels
Full resolution (1,200 × 900 pixels, file size: 16 KB, MIME type: image/png)
| |
This is a file from the Wikimedia Commons. The description on its description page there is shown below. |
| Description |
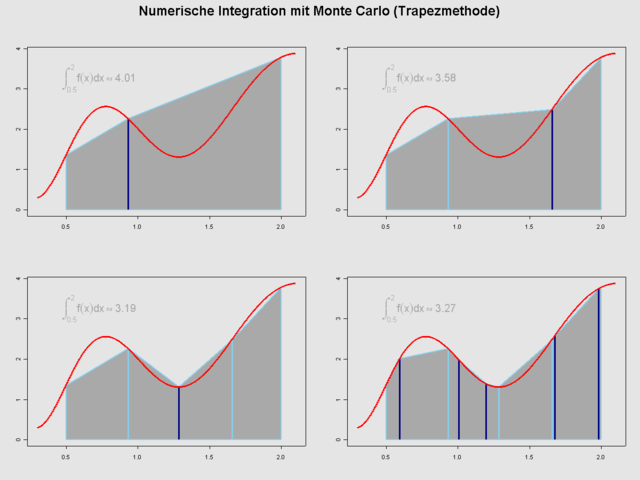
numerical intergration with monte carlo. new points are dark blue (navy), old points are skyblue. points/nodes are uniform distributed over the integration interval. the value of the integral tends to 3,32. |
|---|---|
| Source |
created with the help of GNU R, see source below |
| Date |
13 Apr. 2006 |
| Author |
Thomas Steiner |
| Permission ( Reusing this image) |
Thomas Steiner put it under the GFDL
|
 |
Permission is granted to copy, distribute and/or modify this document under the terms of the GNU Free Documentation license, Version 1.2 or any later version published by the Free Software Foundation; with no Invariant Sections, no Front-Cover Texts, and no Back-Cover Texts. A copy of the license is included in the section entitled " GNU Free Documentation license". Aragonés | العربية | Asturianu | Беларуская (тарашкевіца) | Български | বাংলা | ইমার ঠার/বিষ্ণুপ্রিয়া মণিপুরী | Brezhoneg | Bosanski | Català | Cebuano | Česky | Dansk | Deutsch | Ελληνικά | English | Esperanto | Español | Eesti | Euskara | فارسی | Suomi | Français | Gaeilge | Galego | עברית | Hrvatski | Magyar | Bahasa Indonesia | Ido | Íslenska | Italiano | 日本語 | ქართული | ភាសាខ្មែរ | 한국어 | Kurdî / كوردی | Latina | Lëtzebuergesch | Lietuvių | Bahasa Melayu | Nnapulitano | Nederlands | Norsk (nynorsk) | Norsk (bokmål) | Occitan | Polski | Português | Română | Русский | Slovenčina | Slovenščina | Shqip | Српски / Srpski | Svenska | తెలుగు | ไทย | Tagalog | Türkçe | Українська | اردو | Tiếng Việt | Volapük | Yorùbá | 中文(简体) | 中文(繁體) | +/- |
R-source code:
a=0.5
b=2
cs=c("red","skyblue","navy","darkgrey")

f<-function(x) {
  return( 0.9*sin(9*x^0.6+0.3)+x+0.9 )
}

mc_plot<-function(n,new=1) {
  set.seed(6911)
  x=seq(a*0.6,b*1.05,length=700)
  if (n>0) {
    xi=sort((b-a)*runif(n)+a)
  } else {
    xi=NA
  }
  Xi=sort((b-a)*runif(new)+a)
  pts=sort(c(a,xi,Xi,b))
  plot(x,f(x),type="n",ylim=range(f(x),0),xlab="",ylab="")
  polygon(c(pts,b,a),c(f(pts),0,0),col=cs[4], border=cs[2],lwd=2)
  for (i in xi) {
    segments(i,0,i,f(i),col=cs[2],lwd=3)
  }
  for (i in Xi) {
    segments(i,0,i,f(i),col=cs[3],lwd=3)
  }
  lines(x,f(x),col=cs[1],lwd=3)
  ##calcualte area (integral)
  area=0
  for (p in 1:(length(pts)-1) ) {
    area <- area + (pts[p+1]-pts[p]) * (f(pts[p+1])+f(pts[p])) / 2
  }
  text(x=0.45,y=3.2, labels=substitute(integral(f(x)*dx, A, B)%~~% AREA,list(A=a,B=b,AREA=format(area,digits=3))),cex=1.5,col=cs[4],pos=4)
}


png(filename = "NumInt-MC.png", width=1200, height=900, pointsize = 12)
par(bg="grey90",mfrow=c(2,2), oma=c(0,0,3,0), cex.axis=0.85)
mc_plot(n=0)
mc_plot(n=1)
mc_plot(n=2)
mc_plot(n=3,new=5)
title(main="Numerische Integration mit Monte Carlo (Trapezmethode)", outer=TRUE,cex.main=1.9)
dev.off()
File history
Click on a date/time to view the file as it appeared at that time.
| Date/Time | Dimensions | User | Comment | |
|---|---|---|---|---|
| current | 15:13, 13 April 2006 | 1,200×900 (16 KB) | Thire | ({{Information| |Description = numerical intergration with monte carlo. new points are dark blue (navy), old points are skyblue |Source = created with the help of GNU R, see source below |Date = 13 Apr. 2006 |Author = Thomas Steiner ) |