Image:Piecewise constant.svg
From Wikipedia, the free encyclopedia
Piecewise_constant.svg (SVG file, nominally 600 × 480 pixels, file size: 5 KB)
| |
This is a file from the Wikimedia Commons. The description on its description page there is shown below. |
Summary
| Description |
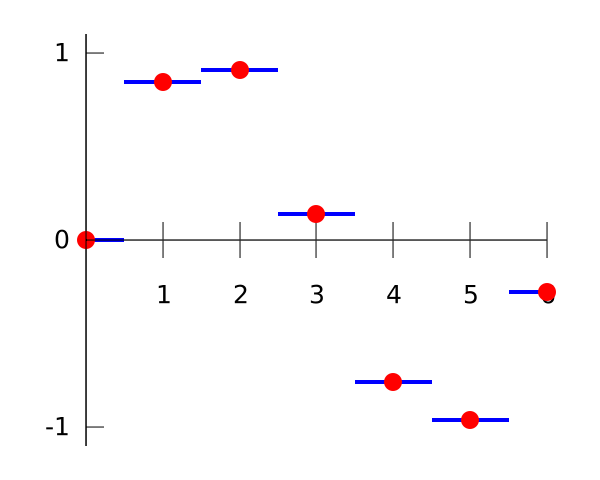
Illustration of constant interpolation, more precisely en:Nearest neighbour interpolation on the same dataset as listed in Interpolation. |
|---|---|
| Source |
self-made in Gnuplot |
| Date |
23 June 2007 |
| Author |
Berland |
| Permission ( Reusing this image) |
see below
|
Gnuplot source code
set terminal svg fname "Vera" fsize 25
set output "Piecewise_constant.svg"
set key off
set xzeroaxis
set xtics axis 1,1
set ytics nomirror 1
set border 2
set yrange [-1.1:1.1]
plot "-" with lines linetype 3 linewidth 4, \
     "-" with lines linetype 3 linewidth 4, \
     "-" with lines linetype 3 linewidth 4, \
     "-" with lines linetype 3 linewidth 4, \
     "-" with lines linetype 3 linewidth 4, \
     "-" with lines linetype 3 linewidth 4, \
     "-" with lines linetype 3 linewidth 4, \
     "-" with points linetype 1 pointtype 7 pointsize 1, \
     0 with lines -1
0 0
0.5 0
e
0.5 0.8415
1.5 0.8415
e
1.5 0.9093
2.5 0.9093
e
2.5 0.1411
3.5 0.1411
e
3.5 -0.7568
4.5 -0.7568
e
4.5 -0.9589
5.5 -0.9589
e
5.5 -0.2794
6.0 -0.2794
e
0 0
1 0.8415
2 0.9093
3 0.1411
4 -0.7568
5 -0.9589
6 -0.2794
e
Licensing
 |
I, Berland, the copyright holder of this work, hereby release it into the public domain. This applies worldwide. In case this is not legally possible: Afrikaans | Alemannisch | Aragonés | العربية | Asturianu | Български | Català | Cebuano | Česky | Cymraeg | Dansk | Deutsch | Eʋegbe | Ελληνικά | English | Español | Esperanto | Euskara | Estremeñu | فارسی | Français | Galego | 한국어 | हिन्दी | Hrvatski | Ido | Bahasa Indonesia | Íslenska | Italiano | עברית | Kurdî / كوردی | Latina | Lietuvių | Latviešu | Magyar | Македонски | Bahasa Melayu | Nederlands | Norsk (bokmål) | Norsk (nynorsk) | 日本語 | Polski | Português | Ripoarisch | Română | Русский | Shqip | Slovenčina | Slovenščina | Српски / Srpski | Suomi | Svenska | ไทย | Tagalog | Türkçe | Українська | Tiếng Việt | Walon | 中文(简体) | 中文(繁體) | zh-yue-hant | +/- |
This version replaces the version of User:Cronholm144, this version has some style changes, and don't have dashed vertical lines.
File history
Click on a date/time to view the file as it appeared at that time.
| Date/Time | Dimensions | User | Comment | |
|---|---|---|---|---|
| current | 16:00, 23 June 2007 | 600×480 (5 KB) | Berland | ( == Summary == {{Information |Description=Illustration of constant interpolation, more precisely en:Nearest neighbour interpolation on the same dataset as listed in Interpolation. |Source=self-made in Gnuplot |Dat) |
| 15:55, 23 June 2007 | 429×425 (16 KB) | Cronholm144 | (made svg) |