Image:SolubilityVsTemperature.png
From Wikipedia, the free encyclopedia

Size of this preview: 613 × 479 pixels
Full resolution (628 × 491 pixels, file size: 10 KB, MIME type: image/png)
File history
Click on a date/time to view the file as it appeared at that time.
| Date/Time | Dimensions | User | Comment | |
|---|---|---|---|---|
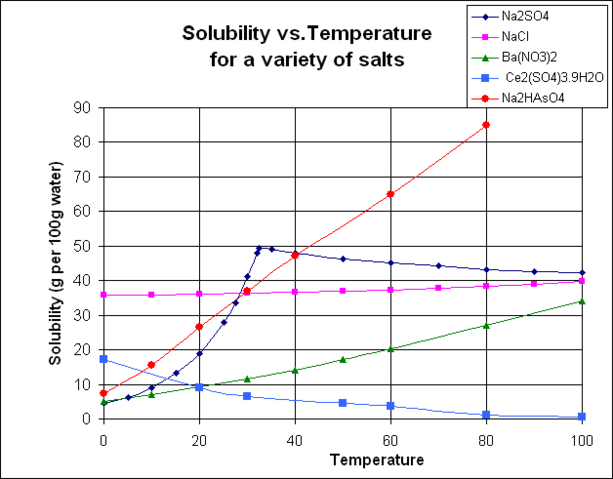
| current | 01:22, 17 February 2007 | 628×491 (10 KB) | Walkerma | (Graph of solubility data for various inorganic salts, drawn in Microsoft Excel by User:Walkerma, February 2006. Data taken from the Handbook of Chemistry and Physics, 27th edition, Chemical Rubber Publishing Co., Cleveland, Ohio, 1943. The last two f) |
| 06:01, 28 January 2007 | 767×538 (363 KB) | Walkerma | (Graph of solubility data for various inorganic salts, drawn in Microsoft Excel and coloured pencil, and scanned in by User:Walkerma, January 2006. Data taken from the Handbook of Chemistry and Physics, 27th edition, CRC Press, 1943. [[Category:Physi) |
File links
The following pages on Schools Wikipedia link to this image (list may be incomplete):
