Image:Normal distribution cdf.png
From Wikipedia, the free encyclopedia
Size of this preview: 640 × 480 pixels
Full resolution (1,300 × 975 pixels, file size: 25 KB, MIME type: image/png)
| |
This is a file from the Wikimedia Commons. The description on its description page there is shown below. |
 A vector version of this image (SVG) is available. For more information about vector graphics, read about Commons transition to SVG. Deutsch | English | Español | Français | Galego | עברית | Magyar | Italiano | 日本語 | 한국어 | Lietuvių | Polski | Português | Русский | Српски / Srpski | Українська | +/- |
 |
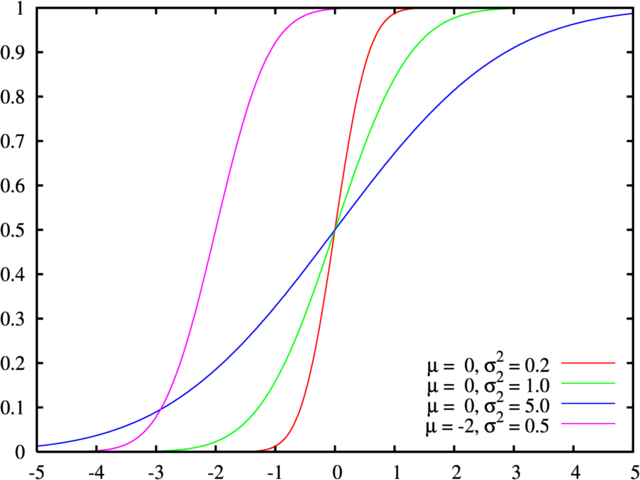
Cumulative distribution function for the normal distribution
 |
Permission is granted to copy, distribute and/or modify this document under the terms of the GNU Free Documentation license, Version 1.2 or any later version published by the Free Software Foundation; with no Invariant Sections, no Front-Cover Texts, and no Back-Cover Texts. A copy of the license is included in the section entitled " GNU Free Documentation license". Aragonés | العربية | Asturianu | Беларуская (тарашкевіца) | Български | বাংলা | ইমার ঠার/বিষ্ণুপ্রিয়া মণিপুরী | Brezhoneg | Bosanski | Català | Cebuano | Česky | Dansk | Deutsch | Ελληνικά | English | Esperanto | Español | Eesti | Euskara | فارسی | Suomi | Français | Gaeilge | Galego | עברית | Hrvatski | Magyar | Bahasa Indonesia | Ido | Íslenska | Italiano | 日本語 | ქართული | ភាសាខ្មែរ | 한국어 | Kurdî / كوردی | Latina | Lëtzebuergesch | Lietuvių | Bahasa Melayu | Nnapulitano | Nederlands | Norsk (nynorsk) | Norsk (bokmål) | Occitan | Polski | Português | Română | Русский | Slovenčina | Slovenščina | Shqip | Српски / Srpski | Svenska | తెలుగు | ไทย | Tagalog | Türkçe | Українська | اردو | Tiếng Việt | Volapük | Yorùbá | 中文(简体) | 中文(繁體) | +/- |
gnuplot source under GPL:
_ln_dnorm(x, m, s) = -0.5 * log(2*pi) - log(s) - 0.5*((x-m)*1.0/s)**2
dnorm(x, mean, sd) = exp(_ln_dnorm(x, mean, sd))
pnorm(x, mean, sd) = norm((x-mean) * 1.0/sd)

set samples 1001
set terminal postscript enhanced colour solid lw 2 "Times-Roman" 20
set output

set xrange [-5:5]
set xtics 1
set yrange [0:1]
set ytics 0.1

#f(x,y,z) = dnorm(x, y, sqrt(z)) #use variance, not sd!
#set key 3.8,0.94

f(x,y,z) = pnorm(x, y, sqrt(z))
set key 3.8,0.2

plot \
    f(x,  0, 0.2) title "{/Symbol m} =  0, {/Symbol s}^2 = 0.2", \
    f(x,  0, 1)   title "{/Symbol m} =  0, {/Symbol s}^2 = 1.0", \
    f(x,  0, 5)   title "{/Symbol m} =  0, {/Symbol s}^2 = 5.0", \
    f(x, -2, 0.5) title "{/Symbol m} = -2, {/Symbol s}^2 = 0.5"
| |
This work is free software; you can redistribute it and/or modify it under the terms of the GNU General Public License as published by the Free Software Foundation; either version 2 of the License, or any later version. This work is distributed in the hope that it will be useful, but WITHOUT ANY WARRANTY; without even the implied warranty of MERCHANTABILITY or FITNESS FOR A PARTICULAR PURPOSE. See version 2 and version 3 of the GNU General Public License for more details. العربية | Català | Česky | Deutsch | Ελληνικά | English | Español | Français | Italiano | 日本語 | Nederlands | Polski | Português | Русский | Slovenčina | 中文(简体) | 中文(繁體) | +/- |
File history
Click on a date/time to view the file as it appeared at that time.
| Date/Time | Dimensions | User | Comment | |
|---|---|---|---|---|
| current | 11:48, 15 October 2006 | 1,300×975 (25 KB) | D.328 | (reduce colors) |
| 03:40, 22 March 2005 | 1,300×975 (136 KB) | MarkSweep | (Cumulative distribution function for the normal distribution {{GFDL}}) |