Image:LinearRegression.svg
From Wikipedia, the free encyclopedia
LinearRegression.svg (SVG file, nominally 600 × 480 pixels, file size: 20 KB)
| |
This is a file from the Wikimedia Commons. The description on its description page there is shown below. |
| Description |
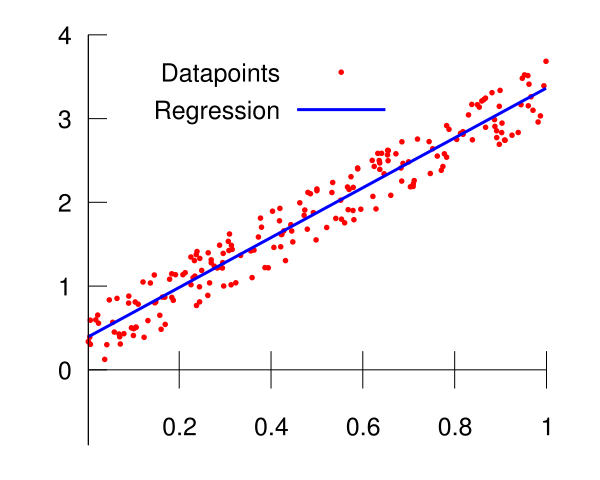
Illustration of linear regression on a data set. |
|---|---|
| Source |
self-made in Gnuplot. |
| Date |
24 June 2007 |
| Author |
Berland |
| Permission ( Reusing this image) |
see below
|
Gnuplot source code
set terminal svg fname "Helvetica" fsize 25
set output "LinearRegression.svg"
set key left
set xtics axis 1,1
set ytics nomirror 1
set border 2
f(x) = a*x + b
fit f(x) 'randpts' using 1:2 via a,b
set yrange [-0.9:4]
plot 'randpts' with points pointtype 7 pointsize 0.3 title 'Datapoints', \
        f(x) with lines linetype 3 linewidth 3 title 'Regression',  \
        0 with lines linetype -1 notitle
The datafile 'randpts' was made in GNU Octave using the commands
f = fopen('randpts', 'w')
for i=1:200;
   x=rand(1);
   y=0.7*rand(1) + 3*x;
   fprintf(f, '%g %g\n', x, y);
end
fclose(f)
(identical code also works in Matlab.)
License
 |
I, Berland, the copyright holder of this work, hereby release it into the public domain. This applies worldwide. In case this is not legally possible: Afrikaans | Alemannisch | Aragonés | العربية | Asturianu | Български | Català | Cebuano | Česky | Cymraeg | Dansk | Deutsch | Eʋegbe | Ελληνικά | English | Español | Esperanto | Euskara | Estremeñu | فارسی | Français | Galego | 한국어 | हिन्दी | Hrvatski | Ido | Bahasa Indonesia | Íslenska | Italiano | עברית | Kurdî / كوردی | Latina | Lietuvių | Latviešu | Magyar | Македонски | Bahasa Melayu | Nederlands | Norsk (bokmål) | Norsk (nynorsk) | 日本語 | Polski | Português | Ripoarisch | Română | Русский | Shqip | Slovenčina | Slovenščina | Српски / Srpski | Suomi | Svenska | ไทย | Tagalog | Türkçe | Українська | Tiếng Việt | Walon | 中文(简体) | 中文(繁體) | zh-yue-hant | +/- |
File history
Click on a date/time to view the file as it appeared at that time.
| Date/Time | Dimensions | User | Comment | |
|---|---|---|---|---|
| current | 20:57, 25 June 2007 | 600×480 (20 KB) | Berland | ({{Information |Description=Illustration of linear regression on a data set. |Source=self-made in Gnuplot. |Date=24 June 2007 |Author= Berland }} ==Gnuplot source code== set terminal svg fname "Helvetic) |
| 18:56, 24 June 2007 | 600×480 (19 KB) | Berland | ({{Information |Description=Illustration of linear regression on a data set. |Source=self-made in Gnuplot. |Date=24 June 2007 |Author= Berland }} ==Gnuplot source code== set terminal svg fname "Helvetic) |