From Wikipedia, the free encyclopedia
 Size of this preview: 480 × 480 pixels
 Full resolution (1,260 × 1,260 pixels, file size: 66 KB, MIME type: image/png)
 |
This is a file from the Wikimedia Commons. The description on its description page there is shown below.Commons is a freely licensed media file repository. You can help.
|
Summary
| Description |
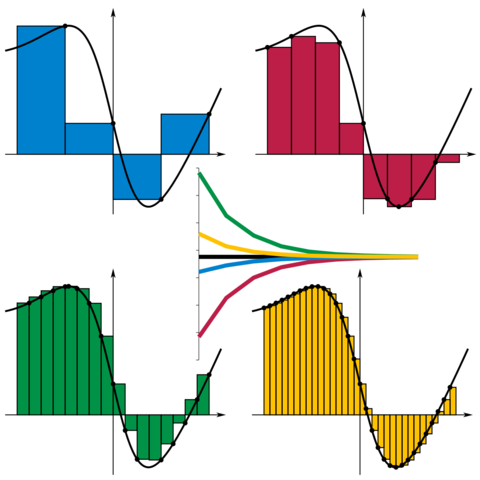
Show convergence of Riemann sum for all sample position choices as intervals shrink |
| Source |
self-made using text editor, rendered by GLIPS Graffiti |
| Date |
2007-07-04 |
| Author |
KSmrq |
Permission
( Reusing this image) |
see below
|
 |
This graph image should be recreated using vector graphics as an SVG file. This has several advantages; see Commons:Media for cleanup for more information. If an SVG form of this image is already available, please upload it. After uploading an SVG, replace this template with {{ vector version available|new image name.svg}}. |
العربية | Български | Català | Česky | Dansk | Deutsch | English | Esperanto | Español | Français | Galego | 한국어 | Italiano | Magyar | Lietuvių | Nederlands | 日本語 | Polski | Português | Română | Русский | Suomi | Svenska | Türkçe | Українська | 中文(繁體) | 中文(简体) | +/- |
Comment
An example of Riemann sums for the integral  sampling each interval at right (blue), minimum (red), maximum (green), or left (yellow). Convergence of all four choices to 3.76 occurs as number of intervals increases from 2 to 10 (and implicitly, to ∞).
Licensing
File history
Click on a date/time to view the file as it appeared at that time.
|
|
Date/Time |
Dimensions |
User |
Comment |
| current |
11:06, 4 July 2007 |
1,260×1,260 (66 KB) |
KSmrq |
|
File links
The following pages on Schools Wikipedia link to this image (list may be incomplete):


 sampling each interval at right (blue), minimum (red), maximum (green), or left (yellow). Convergence of all four choices to 3.76 occurs as number of intervals increases from 2 to 10 (and implicitly, to ∞).