Image:T distributionCDF.png
From Wikipedia, the free encyclopedia

Size of this preview: 640 × 480 pixels
Full resolution (1,200 × 900 pixels, file size: 15 KB, MIME type: image/png)
Summary
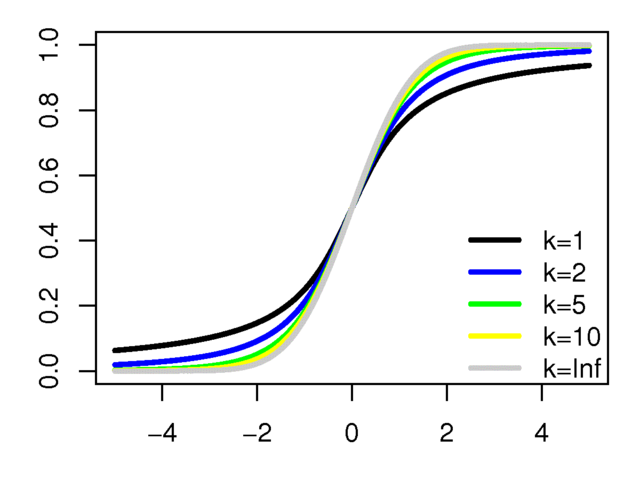
The CDF of the t-distribution
bitmap(file="t_distributionCDF.png",type="png256",width=4,height=3,res=300,pointsize=12)
par(mar=c(3,3,1,1))
x <- seq(-5,5,len=1000)
plot(range(x),c(0,1),type="n")
lines(x,pt(x,df=1),col="black",lwd=3)
lines(x,pt(x,df=2),col="blue",lwd=3)
lines(x,pt(x,df=5),col="green",lwd=3)
lines(x,pt(x,df=10),col="yellow",lwd=3)
lines(x,pt(x,df=Inf),col="grey",lwd=3)
legend(2,0.5,legend=c("k=1","k=2","k=5","k=10","k=Inf"),col=c("black","blue","green","yellow","grey"),lwd=3,bty="n")
dev.off()
 |
This work is free software; you can redistribute it and/or modify it under the terms of the GNU General Public License as published by the Free Software Foundation; either version 2 of the License, or any later version. This work is distributed in the hope that it will be useful, but without any warranty; without even the implied warranty of merchantability or fitness for a particular purpose. See version 2 and version 3 of the GNU General Public License for more details. You should have received a copy of the GNU General Public License along with this program; if not, write to the Free Software Foundation, Inc., 51 Franklin St, Fifth Floor, Boston, MA 02110-1301 USA |
Licensing
 |
I, the creator of this work, hereby grant the permission to copy, distribute and/or modify this document under the terms of the GNU Free Documentation License, Version 1.2 or any later version published by the Free Software Foundation; with no Invariant Sections, no Front-Cover Texts, and no Back-Cover Texts. Subject to disclaimers. |
File history
Click on a date/time to view the file as it appeared at that time.
| Date/Time | Dimensions | User | Comment | |
|---|---|---|---|---|
| current | 13:36, 19 June 2006 | 1,200×900 (15 KB) | Pdbailey ( Talk | contribs) | |
| revert | 21:00, 20 April 2006 | 1,200×1,200 (18 KB) | Pdbailey ( Talk | contribs) | (The CDF of the t-distribution <pre>bitmap(file="t_distributionCDF.png",type="png256",width=4,height=4,res=300,pointsize=12) par(mar=c(3,3,1,1)) x <- seq(-5,5,len=1000) plot(range(x),c(0,1),type="n") lines(x,pt(x,df=1),col="black",lwd=3) lines(x,pt(x,df=2) |
See the setup instructions for more information.
File links
The following pages on Schools Wikipedia link to this image (list may be incomplete):
Categories: GPL images | Self-published work