From Wikipedia, the free encyclopedia
 |
This is a file from the Wikimedia Commons. The description on its description page there is shown below.Commons is a freely licensed media file repository. You can help.
|
Summary
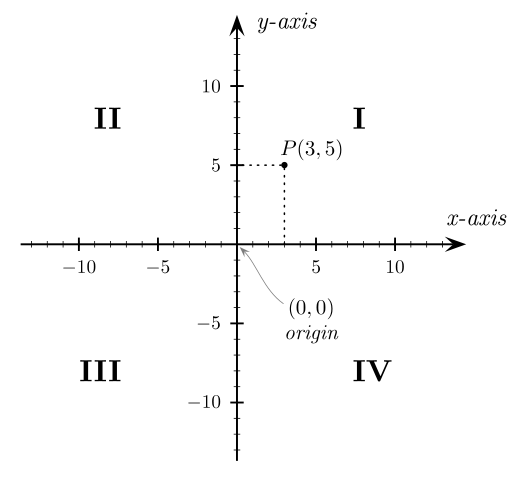
Example for en:Cartesian coordinate system. Created by Gustavb using en:PSTricks.
Licensing
I, the copyright holder of this work, have published or hereby publish it under the following license:
 |
Permission is granted to copy, distribute and/or modify this document under the terms of the GNU Free Documentation license, Version 1.2 or any later version published by the Free Software Foundation; with no Invariant Sections, no Front-Cover Texts, and no Back-Cover Texts. A copy of the license is included in the section entitled " GNU Free Documentation license".
Aragonés | العربية | Asturianu | Беларуская (тарашкевіца) | Български | বাংলা | ইমার ঠার/বিষ্ণুপ্রিয়া মণিপুরী | Brezhoneg | Bosanski | Català | Cebuano | Česky | Dansk | Deutsch | Ελληνικά | English | Esperanto | Español | Eesti | Euskara | فارسی | Suomi | Français | Gaeilge | Galego | עברית | Hrvatski | Magyar | Bahasa Indonesia | Ido | Íslenska | Italiano | 日本語 | ქართული | ភាសាខ្មែរ | 한국어 | Kurdî / كوردی | Latina | Lëtzebuergesch | Lietuvių | Bahasa Melayu | Nnapulitano | Nederlands | Norsk (nynorsk) | Norsk (bokmål) | Occitan | Polski | Português | Română | Русский | Slovenčina | Slovenščina | Shqip | Српски / Srpski | Svenska | తెలుగు | ไทย | Tagalog | Türkçe | Українська | اردو | Tiếng Việt | Volapük | Yorùbá | 中文(简体) | 中文(繁體) | +/- |
|
Source
Cartesian_coordinates_2D.tex (PSTricks source)
\input pst-eps\input pst-plot\input pst-node\TeXtoEPS

\psset{linecolor=black,linewidth=1pt,arrowsize=8pt,unit=0.29cm}
\pspicture*(-15.3,-15.3)(17.4,15.3)

% Axes
\psaxes[Dx=5,Dy=5]{<->}(0,0)(-14.5,-14.5)(14.5,14.5)
\psset{linewidth=.4pt}
\psaxes[Dx=1,Dy=1,labels=none,ticksize=1.5pt](0,0)(-13,-13)(13,13)
\uput{10pt}[0](0,14){\psscalebox{1.25}{\it y-axis}}
\uput{10pt}[70](14,0){\psscalebox{1.25}{\it x-axis}}

% Origin
\pnode(0,0){O}
\uput{35pt}[310](0,0){\rnode{Ot}{\psscalebox{1.1}{
        \vbox{\halign{\hfil#\hfil\cr$(0,0)$\cr\it origin\cr}}}}}
\nccurve[angleA=315,angleB=145,arrowsize=4pt,
        nodesepA=2pt,nodesepB=-3pt,linecolor=gray]{<-}{O}{Ot}

% Point
\psdots[dotstyle=*,dotscale=1.2](3,5)
\psline[linestyle=dotted,linewidth=.8pt](3,0)(3,5)(0,5)
\uput{2.5pt}[53](3,5){\psscalebox{1.1}{$P(3,5)$}}


% Quadrants
\uput{3cm}(0,0){\psscalebox{1.6}{\bf I}}
\uput{3cm}[135](0,0){\psscalebox{1.6}{\bf II}}
\uput{3cm}[225](0,0){\psscalebox{1.6}{\bf III}}
\uput{3cm}[315](0,0){\psscalebox{1.6}{\bf IV}}

\endpspicture
\endTeXtoEPS
\nopagenumbers
\end
Instructions
- Create EPS
$ tex Cartesian_coordinates_2D.tex && dvips -E Cartesian_coordinates_2D.dvi
- Outline fonts
$ eps2eps -dNOCACHE Cartesian_coordinates_2D.ps Cartesian_coordinates_2D2.eps
- Fix bounding box
$ ps2epsi Cartesian_coordinates_2D2.eps Cartesian_coordinates_2D.eps
- Convert to Sketch
$ pstoedit -f sk Cartesian_coordinates_2D.eps Cartesian_coordinates_2D.sk
- Convert to SVG
$ skconvert Cartesian_coordinates_2D.sk Cartesian_coordinates_2D.svg
- Fix Cartesian_coordinates_2D.svg with Inkscape
File history
Click on a date/time to view the file as it appeared at that time.
|
|
Date/Time |
Dimensions |
User |
Comment |
| current |
20:36, 16 March 2007 |
800×742 (57 KB) |
Gustavb |
|
|
|
21:41, 6 March 2006 |
400×371 (57 KB) |
Gustavb |
|
|
|
00:26, 28 February 2006 |
400×371 (57 KB) |
Gustavb |
|
File links
The following pages on Schools Wikipedia link to this image (list may be incomplete):

