Image:Vapor Pressure Chart.png
From Wikipedia, the free encyclopedia

No higher resolution available.
Vapor_Pressure_Chart.png (301 × 397 pixels, file size: 9 KB, MIME type: image/png)
File history
Click on a date/time to view the file as it appeared at that time.
| Date/Time | Dimensions | User | Comment | |
|---|---|---|---|---|
| current | 03:21, 12 October 2007 | 301×397 (9 KB) | Mbeychok | (I am the original author and uploader of the existing Vapor Pressure Chart.png. I had to remove a short line segment that I had failed to erase. ) |
| 03:14, 12 October 2007 | 301×397 (9 KB) | Mbeychok | (This is an improved version of the existing Image:Vapor Pressure Chart.png which has been slightly modified and I am the original author and uploader of the existing image.) | |
| 19:52, 6 October 2007 | 301×397 (9 KB) | Mbeychok | (Made a minor correction/revision to this image file which I uploaded yesterday.This is the revised version. - ~~~~ ) | |
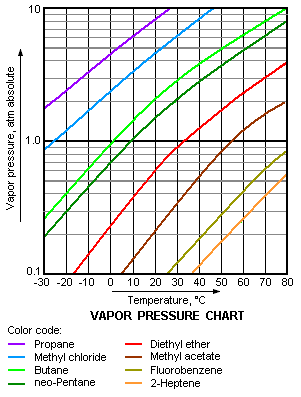
| 04:38, 6 October 2007 | 301×397 (9 KB) | Mbeychok | ({{Information |Description= This image is a chart of vapor pressure versus temperature, for various liquids. The chart's y-axis if logarithmic and the x-axis is linear. |Source=self-made |Date=October 5, 2007 |Author= Mbeychok }} ) |
File links
The following pages on Schools Wikipedia link to this image (list may be incomplete):

