Image:Gamma plot.svg

From Wikipedia, the free encyclopedia

Gamma_plot.svg‎ (SVG file, nominally 600 × 480 pixels, file size: 21 KB)

Wikimedia Commons logo This is a file from the Wikimedia Commons. The description on its description page there is shown below.
Commons is a freely licensed media file repository. You can help.

Summary

Description

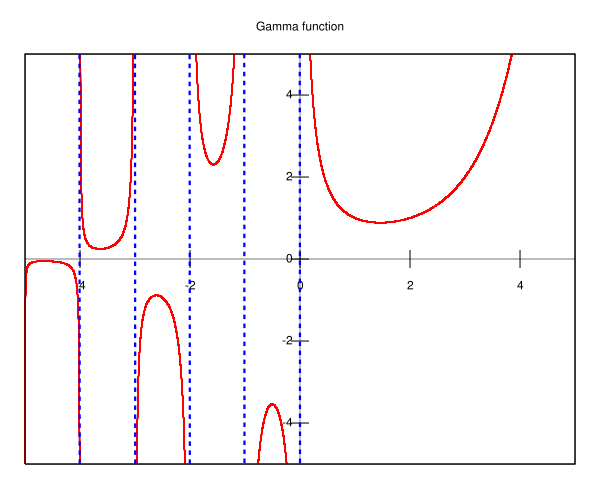
Plot of the Gamma function Γ(x). The plot was produced running Gnuplot on the following code:

set terminal svg
set output "Gamma_plot.svg"
set title "Gamma function"
set xrange [-5:5]
set yrange [-5:5]
set key off
set xzeroaxis linetype -1 linewidth 0.5
set yzeroaxis linetype -1 linewidth 0.5
set xtics axis
set ytics axis
plot "gamma.dat" using 1:2 with lines linewidth 2

the file "gamma.dat" contains the values of the Gamma function and can be produced with the following Matlab commands (it is meant to work in Octave, too, but it returns an error in version 2.1.64):

t = -5:0.01:5;
G = [ t; gamma(t) ];
G = G';
save -ascii "gamma.dat" G;

it was then post-processed with Sodipodi.

Source own work
This vector image was created with gnuplot.
Date

October 2005

Author

Alessio Damato

Permission
( Reusing this image)

see below


Licensing

I, the copyright holder of this work, hereby publish it under the following licenses:
GNU head Permission is granted to copy, distribute and/or modify this document under the terms of the GNU Free Documentation license, Version 1.2 or any later version published by the Free Software Foundation; with no Invariant Sections, no Front-Cover Texts, and no Back-Cover Texts. A copy of the license is included in the section entitled " GNU Free Documentation license".

Aragonés | العربية | Asturianu | Беларуская (тарашкевіца) | Български | বাংলা | ইমার ঠার/বিষ্ণুপ্রিয়া মণিপুরী | Brezhoneg | Bosanski | Català | Cebuano | Česky | Dansk | Deutsch | Ελληνικά | English | Esperanto | Español | Eesti | Euskara | فارسی | Suomi | Français | Gaeilge | Galego | עברית | Hrvatski | Magyar | Bahasa Indonesia | Ido | Íslenska | Italiano | 日本語 | ქართული | ភាសាខ្មែរ | 한국어 | Kurdî / كوردی | Latina | Lëtzebuergesch | Lietuvių | Bahasa Melayu | Nnapulitano | Nederlands | ‪Norsk (nynorsk)‬ | ‪Norsk (bokmål)‬ | Occitan | Polski | Português | Română | Русский | Slovenčina | Slovenščina | Shqip | Српски / Srpski | Svenska | తెలుగు | ไทย | Tagalog | Türkçe | Українська | اردو | Tiếng Việt | Volapük | Yorùbá | ‪中文(简体)‬ | ‪中文(繁體)‬ | +/-

Some rights reserved
Creative Commons Attribution icon Creative Commons Share Alike icon
This file is licensed under the Creative Commons Attribution ShareAlike license versions 2.5, 2.0, and 1.0

العربية | Български | Català | Česky | Dansk | Deutsch | English | Español | Euskara | فارسی | Français | Galego | עברית | Italiano | 日本語 | 한국어 | Lietuvių | Nederlands | Polski | Português | Русский | Svenska | தமிழ் | తెలుగు | Türkçe | 中文 | 中文 | +/-

You may select the license of your choice.

File history

Click on a date/time to view the file as it appeared at that time.

Date/Time Dimensions User Comment
current 17:05, 23 October 2005 600×480 (21 KB) Fredrik
12:09, 12 October 2005 600×480 (21 KB) Alejo2083 ( Plot of the Gamma function <math>\Gamma (x)</math>. The plot was produced running Gnuplot on the following code: <pre> set terminal svg set output "Gamma_plot.svg" set title "Gamma function" set xrange [-5:5] set yr)
The following pages on Schools Wikipedia link to this image (list may be incomplete):
The 2008 Wikipedia for Schools is sponsored by SOS Children , and is mainly selected from the English Wikipedia with only minor checks and changes (see www.wikipedia.org for details of authors and sources). See also our Disclaimer.