From Wikipedia, the free encyclopedia
 No higher resolution available.Floyd_flood_map.jpg
 (350 × 269 pixels, file size: 35 KB, MIME type: image/jpeg)
 |
This is a file from the Wikimedia Commons. The description on its description page there is shown below.Commons is a freely licensed media file repository. You can help.
|
Summary
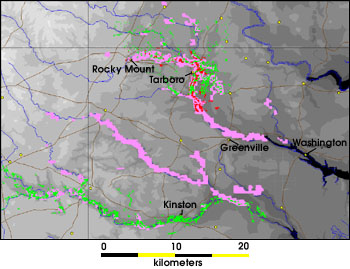
This flood map shows a comparison of the flood data collected by AVHRR (pink pixels), Radarsat (red pixels), and Landsat 7 (green pixels). These colors show areas that were flooded in the wake of Hurricane Floyd. Due to interference from clouds and forest canopies, geographers often get the best insight into a flood when they use data from multiple satellite sensors. (Image courtesy Dartmouth Flood Observatory, E. Anderson and R.H. Brakenridge)
Flood map key
| Colour |
Date |
Source |
|
|
September 17 |
AVHRR |
|
|
September 23 |
Radarsat |
|
|
September 30 |
Landsat 7 |
Source
http://earthobservatory.nasa.gov/Study/FloydSediment/sediment_2.html - a larger image is available; the smaller image is preferred here because the text is larger
Licensing
|
|
This file is in the public domain because it was created by NASA. NASA copyright policy states that "NASA material is not protected by copyright unless noted". ( NASA copyright policy page or JPL Image Use Policy).
Deutsch | English | Español | Français | Galego | Nederlands | Português | Русский | 中文(简体) | 中文(繁體) | +/- |
|
|
|
Warnings:
- Use of NASA logos, insignia and emblems are restricted per US law 14 CFR 1221.
- The NASA website hosts a large number of images from the Soviet/ Russian space agency, and other non-American space agencies. These are not necessarily in the public domain.
- Materials from the Hubble Space Telescope may be copyrighted if they do not explicitly come from the STScI.
- All materials created by the SOHO probe are copyrighted and require permission for commercial non-educational use.
- Images featured on the Astronomy Picture of the Day (APOD) web site may be copyrighted.
|
File history
Click on a date/time to view the file as it appeared at that time.
|
|
Date/Time |
Dimensions |
User |
Comment |
| current |
08:01, 31 January 2006 |
350×269 (35 KB) |
Jdorje |
|
File links
The following pages on Schools Wikipedia link to this image (list may be incomplete):


