From Wikipedia, the free encyclopedia
 |
This is a file from the Wikimedia Commons. The description on its description page there is shown below.Commons is a freely licensed media file repository. You can help.
|
 |
This image was moved to Wikimedia Commons from en.wikipedia using a bot script. All source information is still present. It requires review because CommonSense could not categorise the image during transfer. Additionally, there may be errors in any or all of the information fields; information on this image should not be considered reliable and the image should not be used until it has been reviewed and any needed corrections have been made. Once the review has been completed, this template should be removed. For details, see below. |
| Description |
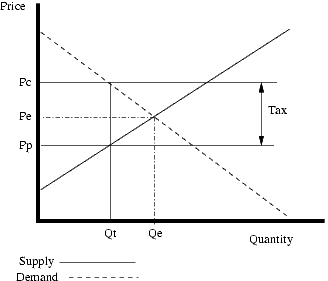
English: A diagram showing the effect of a per unit tax on the standard supply and demand diagram. Created by jrincayc for the purpose of illustrating the effect of taxes and subsidies on price.
|
| Source |
Transferred from en.wikipedia |
| Date |
2002-12-20 (original upload date) |
| Author |
Original uploader was Jrincayc at en.wikipedia |
Permission
( Reusing this image) |
Released under the GNU Free Documentation License.
|
License information
 |
Permission is granted to copy, distribute and/or modify this document under the terms of the GNU Free Documentation License, Version 1.2 or any later version published by the Free Software Foundation; with no Invariant Sections, no Front-Cover Texts, and no Back-Cover Texts.
Subject to disclaimers.
Asturianu | Български | Català | Deutsch | English | Español | Français | Gaeilge | Italiano | Polski | Português | +/- |
 |
This diagram image should be recreated using vector graphics as an SVG file. This has several advantages; see Commons:Media for cleanup for more information. If an SVG form of this image is already available, please upload it. After uploading an SVG, replace this template with {{ vector version available|new image name.svg}}. |
العربية | Български | Català | Česky | Dansk | Deutsch | English | Esperanto | Español | Français | Galego | 한국어 | Italiano | Magyar | Lietuvių | Nederlands | 日本語 | Polski | Português | Română | Русский | Suomi | Svenska | Türkçe | Українська | 中文(繁體) | 中文(简体) | +/- |
Original upload log
The original description page is/was here. All following user names refer to en.wikipedia.
- 2002-12-20 03:15 Jrincayc 328×281×8 (4423 bytes) A diagram showing the effect of a per unit tax on the standard supply and demand diagram.
File history
Click on a date/time to view the file as it appeared at that time.
|
|
Date/Time |
Dimensions |
User |
Comment |
| current |
11:22, 15 July 2008 |
328×281 (2 KB) |
Mahahahaneapneap |
|
|
|
15:52, 19 April 2008 |
328×281 (4 KB) |
File Upload Bot (Magnus Manske) |
|
File links
The following pages on Schools Wikipedia link to this image (list may be incomplete):


