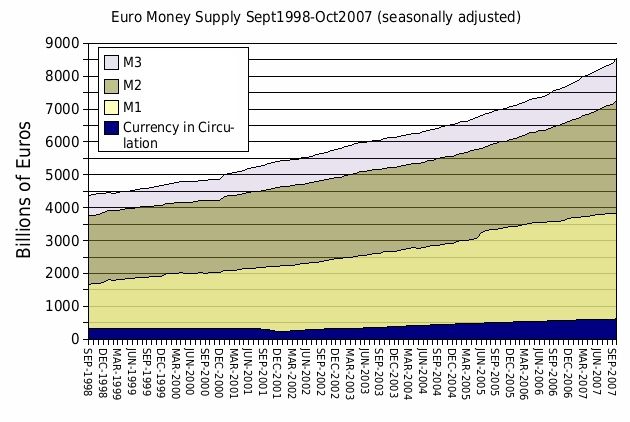
Image:Euro money supply Sept 1998 - Oct 2007.jpg
From Wikipedia, the free encyclopedia

No higher resolution available.
Euro_money_supply_Sept_1998_-_Oct_2007.jpg (630 × 422 pixels, file size: 67 KB, MIME type: image/jpeg)
Summary
| Description |
The Euro money supply from September 1998 through October 2007. |
|---|---|
| Source |
self-made Created with openoffice.org calc using data from the European Central Bank. The M1-M3 statistics were found in the "Historical monetary statistics" file on this page: http://www.ecb.int/stats/services/downloads/html/index.en.html The actual file location is: https://stats.ecb.europa.eu/stats/download/bsi_ma_historical/bsi_ma_historical.zip The amount of currency in circulation was found on the same page but in the "statistics pocket book" link at the right side of the page. The "statistics pocket book" file link is here: http://www.ecb.int/stats/pdf/spb_full.zip The "currency in circulation" data is in the spb027.csv file. |
| Date |
March 2008 |
| Author |
Analoguni ( talk) |
| Permission ( Reusing this image) |
See below. |
Licensing
 |
I, the copyright holder of this work, hereby release it into the public domain. This applies worldwide. In case this is not legally possible, |
File history
Click on a date/time to view the file as it appeared at that time.
| Date/Time | Dimensions | User | Comment | |
|---|---|---|---|---|
| current | 01:24, 3 March 2008 | 630×422 (67 KB) | Analoguni ( Talk | contribs) | ({{Information |Description= The Euro money supply from September 1998 through October 2007. |Source=self-made Created with openoffice.org calc using data from the European Central Bank. The M1-M3 statistics were found in the "Historical monetary stati) |
See the setup instructions for more information.