Image:Hadcm3-era-sst-annual.png
From Wikipedia, the free encyclopedia

Size of this preview: 640 × 372 pixels
Full resolution (1,000 × 581 pixels, file size: 13 KB, MIME type: image/png)
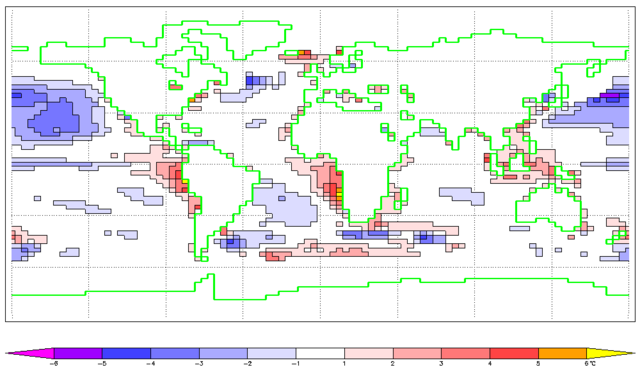
Sea surface temperature difference between HadCM3 and ERA-15; annual mean.
ERA would not be reliable over sea ice, which has accordingly been masked out, as have the land areas.
The SSTs are taken from the ERA dataset for convenience, but are input to ERA from standard sources (obs and satellites).
By William M. Connolley.
 |
Permission is granted to copy, distribute and/or modify this document under the terms of the GNU Free Documentation License, Version 1.2 or any later version published by the Free Software Foundation; with no Invariant Sections, no Front-Cover Texts, and no Back-Cover Texts. Subject to disclaimers. |
File history
Click on a date/time to view the file as it appeared at that time.
| Date/Time | Dimensions | User | Comment | |
|---|---|---|---|---|
| current | 21:21, 13 June 2005 | 1,000×581 (13 KB) | William M. Connolley ( Talk | contribs) | (Sea surface temperature difference between HadCM3 and ERA-15; annual mean. Note that the plot actually shows surface temperatures. ERA would not be reliable over sea ice, which has accordingly been masked out, as have the land areas. The SSTs ar) |
See the setup instructions for more information.
File links
The following pages on Schools Wikipedia link to this image (list may be incomplete):