Image:Climate model NA annual precipitation 2002.jpg
From Wikipedia, the free encyclopedia
Size of this preview: 592 × 480 pixels
Full resolution (659 × 534 pixels, file size: 41 KB, MIME type: image/jpeg)
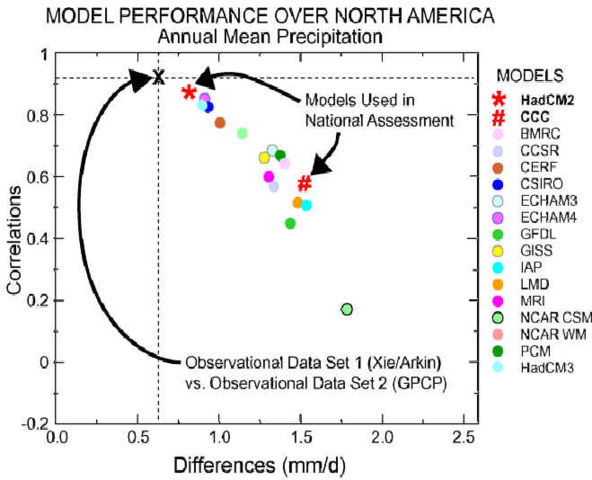
Results of a coupled ocean-atmosphere global Climate Model Intercomparison Project (CMIP) being conducted by the Lawrence Livermore National Laboratory. This comparison relates to the spatial distribution of annual precipitation across North America. All models are compared to the "Xie/Arkin" observational data set. The difference between two differing observation-based data sets reflect observational uncertainties, so we would not expect any model to skillfully exceed these differences. All models are evaluated on the basis of pattern correlations with the observations and the relative differences of annual precipitation integrated across all model grid points in North America. The Hadley Center climate model used in the National Assessment is shown with an "*" and the Canadian Climate Centre is shown with a "#" symbol.
| |
This image was uploaded in the JPEG format even though it consists of non-photographic data. The information it contains could be stored more efficiently or more accurately in the PNG format or SVG format. If possible, please upload a PNG or SVG version of this image, derived from a non-JPEG source so that it doesn't contain any compression artifacts (or with existing artifacts removed) and with transparency where appropriate. After doing so, please replace all instances of the JPEG version throughout Wikipedia (noted under the "File links" header), tag the JPEG version with {{ obsolete|NewImage.ext}}, and remove this tag. For more information, see Wikipedia:Preparing images for upload. |
Source
 |
This work is in the public domain in the United States because it is a work of the United States Federal Government under the terms of Title 17, Chapter 1, Section 105 of the US Code. See Copyright. Note: This only applies to works of the Federal Government and not to the work of any individual U.S. state, territory, commonwealth, county, municipality, or any other subdivision. This template also does not apply to postage stamps published by the United States Postal Service. (See 206.02(b) of Compendium II: Copyright Office Practices). |
 |
Source: http://energycommerce.house.gov/107/hearings/07252002Hearing676/Karl1142.htm
File history
Click on a date/time to view the file as it appeared at that time.
| Date/Time | Dimensions | User | Comment | |
|---|---|---|---|---|
| current | 18:13, 11 April 2005 | 659×534 (41 KB) | SEWilco ( Talk | contribs) | (Results of a coupled ocean-atmosphere global Climate Model Intercomparison Project (CMIP) being conducted by the Lawrence Livermore National Laboratory. This comparison relates to the spatial distribution of annual precipitation across [[North Ame) |
See the setup instructions for more information.