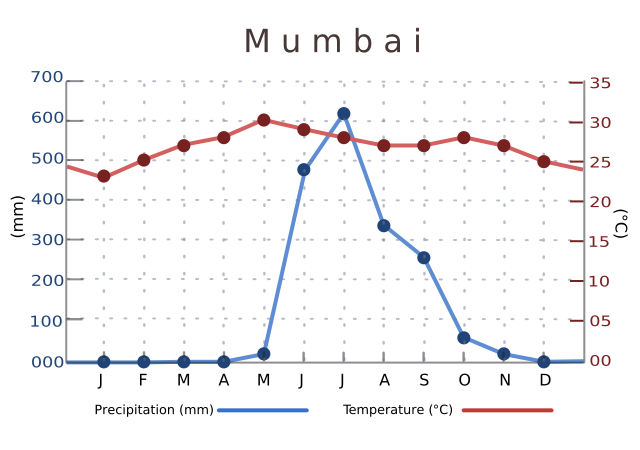
Image:India mumbai temperature precipitation averages chart.svg
From Wikipedia, the free encyclopedia

India_mumbai_temperature_precipitation_averages_chart.svg (SVG file, nominally 800 × 562 pixels, file size: 50 KB)
File history
Click on a date/time to view the file as it appeared at that time.
| Date/Time | Dimensions | User | Comment | |
|---|---|---|---|---|
| current | 19:38, 1 April 2007 | 800×562 (50 KB) | Saravask | ({{Information |Description=Chart showing historical averages of monthly precipitation and temperature in Mumbai, India |Source=Own work |Date=March 2007 |Author=Own work |Permission=See below |other_versions=None }} == Licensing == {{self|GFDL|cc-by-sa-2) |
| 15:18, 1 April 2007 | 800×562 (50 KB) | Saravask | ({{Information |Description=Chart showing historical averages of monthly precipitation and temperature in Mumbai, India |Source=Own work |Date=March 2007 |Author=Own work |Permission=See below |other_versions=None }} == Licensing == {{self|GFDL|cc-by-sa-2) | |
| 15:16, 1 April 2007 | 800×562 (51 KB) | Saravask | (== Summary == == Summary == {{Information |Description=Chart showing historical averages of monthly precipitation and temperature in Mumbai, India |Source=Own work |Date=March 2007 |Author=Own work |Permission=See below |other_versions=None }} == Licensi) | |
| 03:45, 27 March 2007 | 800×562 (52 KB) | Saravask | (== Summary == {{Information |Description=Chart showing historical averages of monthly precipitation and temperature in Mumbai, India |Source=Own work |Date=March 2007 |Author=Own work |Permission=See below |other_versions=None }} ) |
File links
The following pages on Schools Wikipedia link to this image (list may be incomplete):
