Image:2004turkey.PNG
From Wikipedia, the free encyclopedia
Size of this preview: 640 × 281 pixels
Full resolution (1,425 × 625 pixels, file size: 59 KB, MIME type: image/png)
Summary
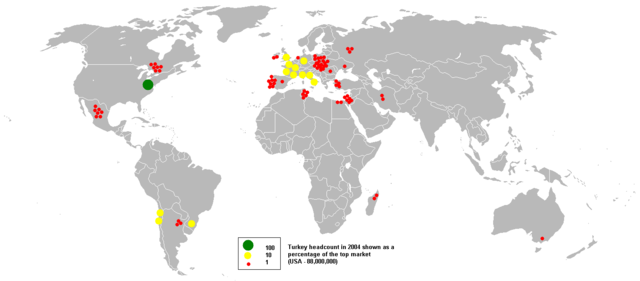
| Description |
This bubble map shows the global distribution of turkeys in 2004 as a percentage of the top market (USA - 88,000,000). This map is consistent with incomplete set of data too as long as the top market is known. It resolves the accessibility issues faced by colour-coded maps that may not be properly rendered in old computer screens. |
|---|---|
| Source |
I created this image entirely by myself based on GLiPHA data |
| Date |
25 - May - 2008 |
| Author |
Anwar ( talk) |
| Permission ( Reusing this image) |
See below. |
Licensing:
 |
I, the copyright holder of this work, hereby release it into the public domain. This applies worldwide. In case this is not legally possible, |
File history
Click on a date/time to view the file as it appeared at that time.
| Date/Time | Dimensions | User | Comment | |
|---|---|---|---|---|
| current | 19:03, 25 May 2008 | 1,425×625 (59 KB) | Anwar saadat ( Talk | contribs) | ({{Information |Description=This bubble map shows the global distribution of turkeys in 2004 as a percentage of the top market (USA - 88,000,000). This map is consistent with incomplete set of data too as long as th) |
See the setup instructions for more information.
File links
The following pages on Schools Wikipedia link to this image (list may be incomplete):
Categories: User-created public domain images