Image:Tropospheric profile Uranus.png
From Wikipedia, the free encyclopedia

Size of this preview: 621 × 480 pixels
Full resolution (3,300 × 2,550 pixels, file size: 110 KB, MIME type: image/png)
Summary
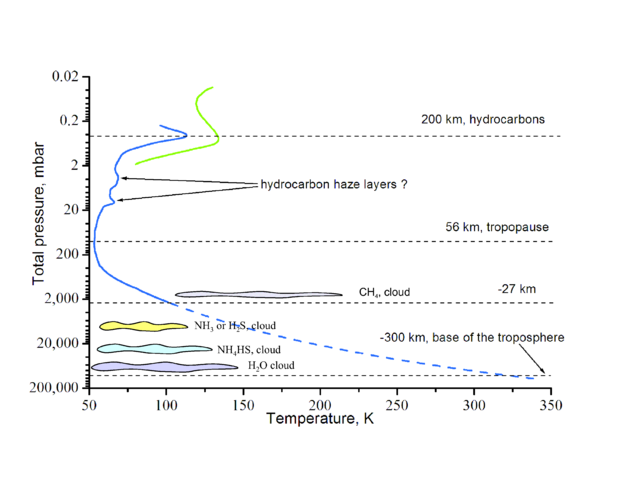
This graph shows temperature profile in the troposphere and in the lower stratosphere of Uranus. Heights are also indicated.
- The dashed blue curve is an extrapolation of the 1987 Lindal et al. data using a constant lapse rate of 0.82 K/km.
- The graph also shows locations of the main cloud and haze layers according to 1990 Bishop et al., Atreya et al. and dePater et al.
References
- ^ a b Lindal, G.F., Lyons, J.R., Sweetnam, D.N., Eshleman, V.R., Hinson, D.P., Tyler, G.L., 1987. The atmosphere of Uranus: Results of radio occultation measurements with Voyager 2. J. Geophys. Res. 92, 14987–15001 (Table 1);
- ^ a b Bishop, J.; Atreya, S.K.; Herbert, F.; and Romani, P. (1990). "Reanalysis of Voyager 2 UVS Occultations at Uranus: Hydrocarbon Mixing Ratios in the Equatorial Stratosphere", Icarus 88: 448–463 (Table 1).
- ^ Atreya, S.; Egeler, P.; Baines, K. (2006). "Water-ammonia ionic ocean on Uranus and Neptune?", Geophysical Research Abstracts 8: 05179
- ^ dePater, Imke; Romani, Paul N.; Atreya, Sushil K. (1991). "Possible Microwave Absorbtion in by H2S gas Uranus’ and Neptune’s Atmospheres", Icarus 91: 220–233.
Licensing
 |
I, the copyright holder of this work, hereby grant the permission to copy, distribute and/or modify this document under the terms of the GNU Free Documentation License, Version 1.2 or any later version published by the Free Software Foundation; with no Invariant Sections, no Front-Cover Texts, and no Back-Cover Texts. |
File history
Click on a date/time to view the file as it appeared at that time.
| Date/Time | Dimensions | User | Comment | |
|---|---|---|---|---|
| current | 17:38, 25 August 2007 | 3,300×2,550 (110 KB) | Ruslik0 ( Talk | contribs) | (This graph shows temperature profile in the troposphere and in the lower stratosphere of Uranus. Heights are also indicated. Blue curve is from Lindal, G.F., Lyons, J.R., Sweetnam, D.N., Eshleman, V.R., Hinson, D.P., Tyler, G.L., 1987. The atmosphere of ) |
| revert | 13:51, 25 August 2007 | 3,300×2,550 (94 KB) | Ruslik0 ( Talk | contribs) | (This graph shows temperature profile in the troposphere and in the lower stratosphere of Uranus. Heights are also indicated. Blue curve is from Lindal, G.F., Lyons, J.R., Sweetnam, D.N., Eshleman, V.R., Hinson, D.P., Tyler, G.L., 1987. The atmosphere of) |
See the setup instructions for more information.
File links
The following pages on Schools Wikipedia link to this image (list may be incomplete):
Categories: Self-published work | GFDL images