Image:Internet-explorer-usage-data.svg

From Wikipedia, the free encyclopedia
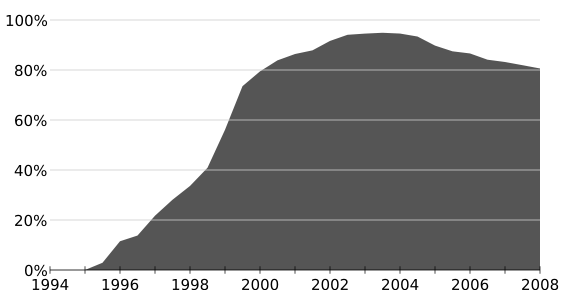
Internet-explorer-usage-data.svg‎ (SVG file, nominally 570 × 290 pixels, file size: 5 KB)

Wikimedia Commons logo This is a file from the Wikimedia Commons. The description on its description page there is shown below.
Commons is a freely licensed media file repository. You can help.

Summary

Description

This file is in SVG format. That means you can edit it with a text editor or an SVG-compatible graphics editor. However, you will find it better to use a text editor because otherwise your edits will be too imprecise.

Adding new data

If the data is between 1996 and 2006, just find that point in the file and update it. For example, at the moment the code for the usage statistics between 2000 and 2001 looks like this:

L 2000,83.75
L 2001,90

To insert data for the midpoint of 2000, just make it look like this:

L 2000,83.75
L 2000.5,86
L 2001,90

If you are adding data for before 1996 or after 2006, you'll need to change the transformations on the groups. This requires moderately detailed understanding of SVG. Seek help if you need it.

Source

The original graph is at en::Image:Internet Explorer usage share.png. That is the original source of the data. The data at the time of this SVG's creation was:

"Date","Percentage"
1996,3.75
1997,17.5
1998,35
1999,62.5
2000,83.75
2001,90
2002,95.25
2003,94.75
2004,92.625
2005,86.903861
2006,1

El T 13:11, 25 June 2006 (UTC)

Source

Originally from en.wikipedia; description page is/was here.

Date

2006-06-25 (first version); 2007-02-02 (last version)

Author

Original uploader was El T at en.wikipedia Later versions were uploaded by Henrikb4, Schapel at en.wikipedia.

Permission
( Reusing this image)

Released into the public domain (by the author).


License information

Public domain This image has been (or is hereby) released into the public domain by its author, El T at the wikipedia project. This applies worldwide.

In case this is not legally possible:
El T grants anyone the right to use this work for any purpose, without any conditions, unless such conditions are required by law.

Original upload log

(All user names refer to en.wikipedia)

  • 2007-02-02 14:08 Schapel 570×290×0 (4065 bytes) New graph created from data in the [[usage share]] article
  • 2006-08-17 14:58 Henrikb4 566×290×0 (3084 bytes)
  • 2006-06-25 13:11 El T 566×290×0 (3108 bytes) An SVG version of the graph. The easiest way to update the graph is to use a TEXT editor, NOT a graphics one. Just find the list of numbers and add in the statistic you want to use. Just make sure you put them in order. If you are adding data for before

File history

Click on a date/time to view the file as it appeared at that time.

Date/Time Dimensions User Comment
current 22:27, 10 February 2008 570×290 (5 KB) Schapel ({{Information |Description=Usage share of Internet Explorer |Source=self-made |Date=2008-02-10 |Author= Schapel |Permission= |other_versions= }} )
22:08, 10 February 2008 570×290 (5 KB) Schapel ({{Information |Description=Usage share of Internet Explorer |Source=self-made |Date=2008-02-10 |Author= Schapel |Permission= |other_versions= }} )
21:02, 7 July 2007 600×290 (4 KB) SteveSims (Midway through 2007 data added. Remember to delete the 2007.5 tick when the end of 2007/beginning of 2008 data is added.)
15:08, 2 April 2007 570×290 (4 KB) Liftarn ({{Information |Description=This file is in SVG format. That means you can edit it with a text editor or an SVG-compatible graphics editor. ''However,'' you will find it better to use a text editor because otherwise your edits will be too imprecise. === A)
The following pages on Schools Wikipedia link to this image (list may be incomplete):
This Wikipedia Selection has a sponsor: SOS Children , and consists of a hand selection from the English Wikipedia articles with only minor deletions (see www.wikipedia.org for details of authors and sources). See also our Disclaimer.