From Wikipedia, the free encyclopedia
 |
This is a file from the Wikimedia Commons. The description on its description page there is shown below.Commons is a freely licensed media file repository. You can help.
|
Description
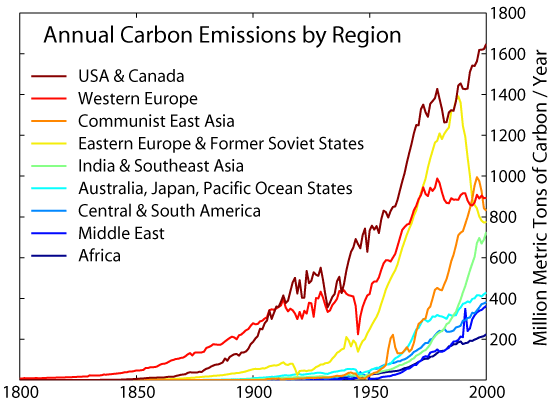
This figure shows the annual fossil fuel carbon dioxide emissions, in million metric tons of carbon, for a variety of non-overlapping regions covering the Earth.
Data source: Carbon Dioxide Information Analysis Centre .
Regions are sorted from largest emitter (as of 2000) to the smallest and links to the original data and lists of countries appear below:
- The USA & Canada:
- Western Europe (plus Germany):
- Communist East Asia ( China, North Korea, Mongolia, etc.):
- Eastern Europe, Russia, and Former Soviet States: South Korea): Japan & other Pacific Island States: South America (includes Mexico and the Caribbean):
- The Middle East:
Copyright
This figure was originally prepared by Robert A. Rohde from publicly available data, and is incorporated into the Global Warming Art project.
Image from Global Warming Art
This image is an original work created for Global Warming Art.
Permission is granted to copy, distribute and/or modify this image under either:
- The GNU Free Documentation License Version 1.2; with no Invariant Sections, Front-Cover Texts, or Back-Cover Texts.
- The Creative Commons Attribution-NonCommercial-ShareAlike License Version 2.5
Please refer to the image description page on Global Warming Art for more information
 |
Permission is granted to copy, distribute and/or modify this document under the terms of the GNU Free Documentation License, Version 1.2 only as published by the Free Software Foundation; with no Invariant Sections, no Front-Cover Texts, and no Back-Cover Texts. A copy of the license is included in the section entitled " Text of the GNU Free Documentation License."
Català | English | Español | Français | 日本語 | Polski | Português | Русский | Tiếng Việt | 中文(简体) | 中文(繁體) | +/- |
Related figures
Total global carbon emissions, logarithmic scale.
|
Total global carbon emissions by type, linear scale.
|
Carbon dioxide concentrations during the last 400 thousand years.
|
Recent carbon dioxide concentrations measured at Mauna Loa.
|
Other languages
中文: Image:Carbon Emission by Region (zh).png
日本語: Image:Carbon_Emission_by_Region_ja.png
File history
Click on a date/time to view the file as it appeared at that time.
|
|
Date/Time |
Dimensions |
User |
Comment |
| current |
18:55, 3 December 2005 |
551×402 (28 KB) |
Mats Halldin |
|
File links
The following pages on Schools Wikipedia link to this image (list may be incomplete):


