Image:Energy Intensity.png
From Wikipedia, the free encyclopedia

Size of this preview: 640 × 412 pixels
Full resolution (1,183 × 761 pixels, file size: 14 KB, MIME type: image/png)
Summary
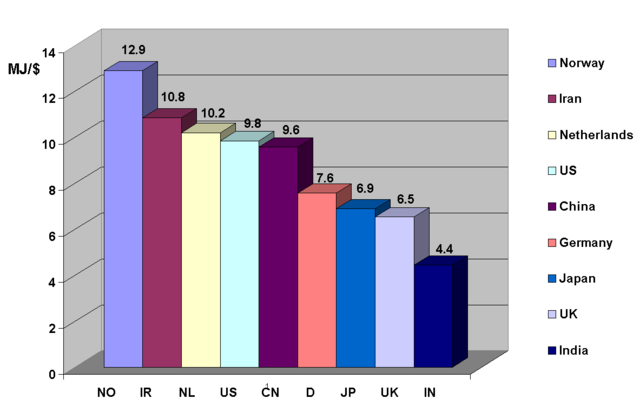
This means that India is the most energy efficient country of those shown in the chart, or that India uses the most human labor in the creation of product.
| |
This graph image was uploaded in a raster image format such as PNG, GIF, or JPEG. However, it contains information that could be stored more efficiently and/or accurately in the SVG format, as a vector graphic. If possible, please upload an SVG version of this image. After doing so, please replace all instances of the previous version throughout Wikipedia (noted under the “File links” header), tag the old version with {{ Vector version available|NewImage.svg}}, and remove this tag. For more information, see Wikipedia:Preparing images for upload. For assistance with converting to SVG, please see the Graphics Lab. |
 |
Author: Frank van Mierlo
I created this graph from 2004 data supplied by the US IEA in their 2006 report. URL: http://www.eia.doe.gov/pub/international/iealf/tablee1p.xls Please credit the author if you use this image.
Licensing
|
File history
Click on a date/time to view the file as it appeared at that time.
| Date/Time | Dimensions | User | Comment | |
|---|---|---|---|---|
| current | 01:45, 2 February 2007 | 1,183×761 (14 KB) | Mierlo ( Talk | contribs) | (==Author: Frank van Mierlo== I created this graph from 2004 data supplied by the US IEA in their 2006 report. url: http://www.eia.doe.gov/pub/international/iealf/tablee1p.xls Please credit the author if you use this image. ) |
See the setup instructions for more information.
File links
The following file is a duplicate of this file:
The following pages on Schools Wikipedia link to this image (list may be incomplete):
Categories: Graph images that should be in SVG format | Creative Commons Attribution 2.5 images | Self-published work | Energy use comparisons
