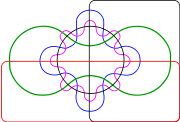
Venn diagram
2008/9 Schools Wikipedia Selection. Related subjects: Mathematics
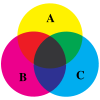
Venn diagrams are illustrations used in the branch of mathematics known as set theory. Invented in 1881 by John Venn, they show all of the possible mathematical or logical relationships between sets (groups of things). They normally consist of overlapping circles. For instance, in a two set Venn diagram, one circle may represent all things that are liquid at room temperature, while another circle may represent the set of all chemical elements. The overlapping area (intersection) would then represent things that are both liquid at room temperature and elements, e.g. mercury. Other shapes can be employed (see below), and this is necessary for more than three sets.
Origins
The Hull-born British philosopher and mathematician John Venn (1834-1923) introduced the Venn diagram in 1881.
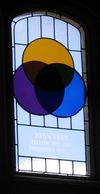
A stained glass window in Caius College, Cambridge, where Venn studied and spent most of his life, commemorates him and represents a Venn diagram.
Examples
The orange circle (set A) might represent, for example, all living creatures that are two-legged. The blue circle, (set B) might represent living creatures that can fly. The area where the blue and orange circles overlap contains all living creatures that can fly and that have two legs — for example, parrots. (Imagine each separate type of creature as a point somewhere in the diagram.)
Humans and penguins would be in the orange circle, in the part which does not overlap with the blue circle. Mosquitoes have six legs, and fly, so the point for mosquitoes would be in the part of the blue circle which does not overlap with the orange one. Things which are not two-legged and cannot fly (for example, whales and spiders) would all be represented by points outside both circles. Technically, the Venn diagram above can be interpreted as "the relationships of set A and set B that may have some (but not all) elements in common".
The combined area of sets A and B is called the union of A and B, denoted by AUB. The union in this case contains all things that either have two legs, or which fly, or both.
The area in both A and B, where the two sets overlap, is called the intersection of A and B, denoted by A∩B. The intersection of the two sets is not empty, because the circles overlap, i.e. there are creatures that are in both the orange and blue circles.
Sometimes a rectangle called the " Universal set" is drawn around the Venn diagram to show the space of all possible things. As mentioned above, a whale would be represented by a point that is not in the union, but is in the Universe (of living creatures, or of all things, depending on how one chose to define the Universe for a particular diagram).
Extensions to higher numbers of sets
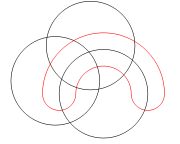
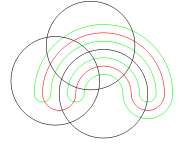
Venn diagrams typically have three sets. Venn was keen to find symmetrical figures…elegant in themselves representing higher numbers of sets and he devised a four set diagram using ellipses. He also gave a construction for Venn diagrams with any number of curves, where each successive curve is interleaved with previous curves, starting with the 3-circle diagram.
Simple Symmetric Venn Diagrams
D. W. Henderson showed in 1963 that the existence of an n-Venn diagram with n-fold rotational symmetry implied that n was prime. He also showed that such symmetric Venn diagrams exist when n is 5 or 7. In 2002 Peter Hamburger found symmetric Venn diagrams for n = 11 and in 2003, Griggs, Killian, and Savage showed that symmetric Venn diagrams exist for all other primes. Thus symmetric Venn diagrams exist if and only if n is a prime number.
Edwards' Venn diagrams
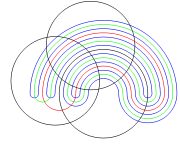
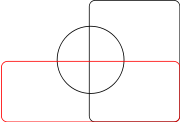
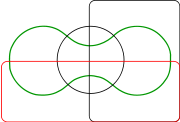
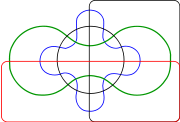
A. W. F. Edwards gave a construction to higher numbers of sets that features some symmetries. His construction is achieved by projecting the Venn diagram onto a sphere. Three sets can be easily represented by taking three hemispheres at right angles (x≥0, y≥0 and z≥0). A fourth set can be represented by taking a curve similar to the seam on a tennis ball which winds up and down around the equator. The resulting sets can then be projected back to the plane to give cogwheel diagrams with increasing numbers of teeth. These diagrams were devised while designing a stained-glass window in memoriam to Venn.
Other diagrams
Edwards' Venn diagrams are topologically equivalent to diagrams devised by Branko Grünbaum which were based around intersecting polygons with increasing numbers of sides. They are also 2-dimensional representations of hypercubes.
Smith devised similar n-set diagrams using sine curves with equations y=sin(2ix)/2i, 0≤i≤n-2.
Charles Lutwidge Dodgson (a.k.a. Lewis Carroll) devised a five set diagram.
Classroom use
Venn diagrams are often used by teachers in the classroom as a mechanism to help students compare and contrast two items. Characteristics are listed in each section of the diagram, with shared characteristics listed in the overlapping section.
