From Wikipedia, the free encyclopedia
 |
This is a file from the Wikimedia Commons. The description on its description page there is shown below.Commons is a freely licensed media file repository. You can help.
|
Summary
| Description |
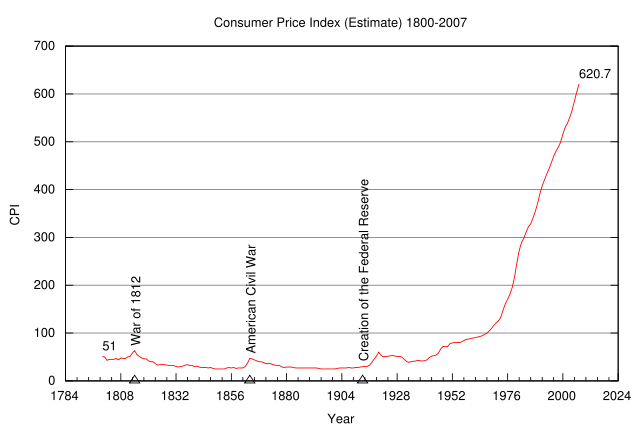
The United States Consumer Price Index from 1800 through 2007 |
| Source |
self-made from the data here: http://www.minneapolisfed.org/Research/data/us/calc/hist1800.cfm |
| Date |
16 March 2008 |
| Author |
Nkocharh |
Permission
( Reusing this image) |
In the public domain
|
Licensing:
|
|
I, the copyright holder of this work, hereby release it into the public domain. This applies worldwide.
In case this is not legally possible:
I grant anyone the right to use this work for any purpose, without any conditions, unless such conditions are required by law.
Afrikaans | Alemannisch | Aragonés | العربية | Asturianu | Български | Català | Cebuano | Česky | Cymraeg | Dansk | Deutsch | Eʋegbe | Ελληνικά | English | Español | Esperanto | Euskara | Estremeñu | فارسی | Français | Galego | 한국어 | हिन्दी | Hrvatski | Ido | Bahasa Indonesia | Íslenska | Italiano | עברית | Kurdî / كوردی | Latina | Lietuvių | Latviešu | Magyar | Македонски | Bahasa Melayu | Nederlands | Norsk (bokmål) | Norsk (nynorsk) | 日本語 | Polski | Português | Ripoarisch | Română | Русский | Shqip | Slovenčina | Slovenščina | Српски / Srpski | Suomi | Svenska | ไทย | Tagalog | Türkçe | Українська | Tiếng Việt | Walon | 中文(简体) | 中文(繁體) | zh-yue-hant | +/- |
gnuplot file used to make this graph
set terminal svg enhanced fsize 12 size 750,500
set output 'USACPI1800.svg'
set datafile separator "\t"
set style data lines

set title "Consumer Price Index (Estimate) 1800-2007"
set nokey

set xdata time
set format x "%Y"
set timefmt "%Y"

set xtics nomirror
set noy2tics
set xlabel "Year"
set ylabel "CPI"
set grid noxtics
set grid ytics

# Label for the creation of the Fed
# You shouldn't need to change this.
set label 1 "Creation of the Federal Reserve" at "1913",1 rotate point pointtype 8 offset -0.3,1

# Label for the initial CPI
# You shouldn't need to change this.
set label 2 "51" at "1800",1 offset first 0,71

# Label for the War of 1812
# You shouldn't need to change this.
set label 3 "War of 1812" at "1814",1 rotate point pointtype 8 offset -0.3,2

# Label for the Civil War
# You shouldn't need to change this.
set label 4 "American Civil War" at "1864",1 rotate point pointtype 8 offset -0.3,1.5

# Label for the current CPI.
####
# You need to change this!!
####
# Looks like the offset's y needs to be about 20 more than the CPI value we're labeling.
set label 5 "620.7" at "2007",1 offset first 0,640

plot 'cpi.dat' using 1:2
Data file used to make this graph
#Consumer Price Index (Estimate)
# Data taken from http://www.minneapolisfed.org/Research/data/us/calc/hist1800.cfm on 16 March 2008

Year    CPI
1800    51
1801    50
1802    43
1803    45
1804    45
1805    45
1806    47
1807    44
1808    48
1809    47
1810    47
1811    50
1812    51
1813    58
1814    63
1815    55
1816    51
1817    48
1818    46
1819    46
1820    42
1821    40
1822    40
1823    36
1824    33
1825    34
1826    34
1827    34
1828    33
1829    32
1830    32
1831    32
1832    30
1833    29
1834    30
1835    31
1836    33
1837    34
1838    32
1839    32
1840    30
1841    31
1842    29
1843    28
1844    28
1845    28
1846    27
1847    28
1848    26
1849    25
1850    25
1851    25
1852    25
1853    25
1854    27
1855    28
1856    27
1857    28
1858    26
1859    27
1860    27
1861    27
1862    30
1863    37
1864    47
1865    46
1866    44
1867    42
1868    40
1869    40
1870    38
1871    36
1872    36
1873    36
1874    34
1875    33
1876    32
1877    32
1878    29
1879    28
1880    29
1881    29
1882    29
1883    28
1884    27
1885    27
1886    27
1887    27
1888    27
1889    27
1890    27
1891    27
1892    27
1893    27
1894    26
1895    25
1896    25
1897    25
1898    25
1899    25
1900    25
1901    25
1902    26
1903    27
1904    27
1905    27
1906    27
1907    28
1908    27
1909    27
1910    28
1911    28
1912    29
1913    29.7
1914    30.1
1915    30.4
1916    32.7
1917    38.4
1918    45.1
1919    51.8
1920    60.0
1921    53.6
1922    50.2
1923    51.1
1924    51.2
1925    52.5
1926    53.0
1927    52.0
1928    51.3
1929    51.3
1930    50.0
1931    45.6
1932    40.9
1933    38.8
1934    40.1
1935    41.1
1936    41.5
1937    43.0
1938    42.2
1939    41.6
1940    42.0
1941    44.1
1942    48.8
1943    51.8
1944    52.7
1945    53.9
1946    58.5
1947    66.9
1948    72.1
1949    71.4
1950    72.1
1951    77.8
1952    79.5
1953    80.1
1954    80.5
1955    80.2
1956    81.4
1957    84.3
1958    86.6
1959    87.3
1960    88.7
1961    89.6
1962    90.6
1963    91.7
1964    92.9
1965    94.5
1966    97.2
1967    100.0
1968    104.2
1969    109.8
1970    116.3
1971    121.3
1972    125.3
1973    133.1
1974    147.7
1975    161.2
1976    170.5
1977    181.5
1978    195.4
1979    217.4
1980    246.8
1981    272.4
1982    289.1
1983    298.4
1984    311.1
1985    322.2
1986    328.4
1987    340.4
1988    354.3
1989    371.3
1990    391.4
1991    408.0
1992    420.3
1993    432.7
1994    444.0
1995    456.5
1996    469.9
1997    480.8
1998    488.3
1999    499.1
2000    515.8
2001    530.1
2002    538.8
2003    551.0
2004    565.7
2005    584.8
2006    603.5
2007    620.7
File history
Click on a date/time to view the file as it appeared at that time.
|
|
Date/Time |
Dimensions |
User |
Comment |
| current |
09:58, 16 March 2008 |
750×500 (14 KB) |
Nkocharh |
|
|
|
09:45, 16 March 2008 |
750×500 (29 KB) |
Nkocharh |
|
File links
The following pages on Schools Wikipedia link to this image (list may be incomplete):

