Mass spectrometry
2008/9 Schools Wikipedia Selection. Related subjects: Chemistry
Mass spectrometry is an analytical technique that measures the mass-to-charge ratio of charged particles. It is most generally used to find the composition of a physical sample by generating a mass spectrum representing the masses of sample components. The mass spectrum is measured by a mass spectrometer.

Mass spectrometers consist of three basic parts: an ion source, a mass analyzer, and a detector system. The stages within the mass spectrometer are:
- Production of ions from the sample
- Separation of ions with different masses
- Detection of the number of ions of each mass produced
- Collection of data to generate the mass spectrum
The technique is applicable in:
- identifying unknown compounds by the mass of the compound molecules or their fragments
- determining the isotopic composition of elements in a compound
- determining the structure of a compound by observing its fragmentation
- quantifying the amount of a compound in a sample using carefully designed methods (mass spectrometry is not inherently quantitative)
- studying the fundamentals of gas phase ion chemistry (the chemistry of ions and neutrals in vacuum)
- determining other important physical, chemical, or even biological properties of compounds with a variety of other approaches
Etymology
Early devices that measured the mass-to-charge ratio of ions were called mass spectrographs because they were instruments that recorded a spectrum of mass values on a photographic plate. Removing several letters, such as the bound morphemes and free morphemes, and combining the lingustical roots of spectr-um and phot-ograph-ic plate creates the word spectrograph. A mass spectroscope is similar to a mass spectrograph except that the beam of ions is directed onto a phosphor screen. The suffix -scope here denotes the direct viewing of the spectra (range) of masses. A mass spectroscope configuration was used in early instruments when it was desired that the effects of adjustments be quickly observed. Once the instrument was properly adjusted, a photographic plate was inserted and exposed. The term mass spectroscope continued to be used even though the direct illumination of a phosphor screen was replaced by indirect measurements with an oscilloscope. Mass spectroscopy has been used in the past, and is a strictly correct etymology, literally an instrument for the viewing of a range of masses, but is now discouraged due to the possibility of confusion with light spectroscopy. The terms mass spectroscopy and mass spectrometry are currently used, although the latter is strongly preferred. Mass spectrometry is often abbreviated as mass-spec or simply as MS.
History

In 1886, Eugen Goldstein observed "rays" that travelled through the channels of a perforated cathode in a low pressure gas discharge and moved toward the anode, in the opposite direction to the negatively charged cathode rays. Goldstein called these positively charged anode rays "Kanalstrahlen" or canal rays. Wilhelm Wien found that strong electric or magnetic fields deflected the canal rays and, in 1899, constructed a device with parallel electric and magnetic fields that separated the positive rays according to their charge-to-mass ratio (Q/m). Wien found that the charge-to-mass ratio depended on the nature of the gas in the discharge tube. English scientist J.J. Thomson later improved on the work of Wilhelm Wien by reducing the pressure to create a mass spectrograph. The processes that more directly gave rise to the modern version of the mass spectrometer were devised by Arthur Jeffrey Dempster and F.W. Aston in 1918 and 1919 respectively.
In 1989, half of the Nobel Prize in Physics was received by Hans Dehmelt and Wolfgang Paul for the development of the ion trap technique in the 1950s and 1960s.
In 2002, the Nobel Prize in Chemistry was received by John Bennett Fenn for the development of electrospray ionization (ESI) and Koichi Tanaka for the development of soft laser desorption (SLD) in 1987. An improved SLD method, matrix-assisted laser desorption/ionization (MALDI), was developed in 1987 by Franz Hillenkamp and Michael Karas.
Simplified working example

Different chemicals have different masses, and this fact is used in a mass spectrometer to determine what chemicals are present in a sample. For example, table salt (NaCl), may be vaporized (turned into gas) and ionized (broken down) into electrically charged particles (Na+ and Cl-), called ions, in the first phase of the mass spectrometry. The sodium ions are monoisotopic, with mass 23 u. Chloride ions have two isotopes of mass 35 u (~75%) and mass 37 u (~25%). They also have a charge, which means that the speed and direction may be changed with an electric or magnetic field. An electric field accelerates the ions to a high speed. After this, they are directed into a magnetic field which applies a force to each ion perpendicular to the plane defined by the particles' direction of travel and the magnetic field lines. This force deflects the ions (makes them curve instead of traveling in a straight line) to varying degrees depending on their mass-to-charge ratio. Lighter ions get deflected more than the heavier ions. This is due to Newton's second law of motion. The acceleration of a particle is inversely proportional to its mass. Therefore, the magnetic field deflects the lighter ions more than it does the heavier ions. The detector measures the deflection of each resulting ion beam. From this measurement, the mass-to-charge ratios of all the ions produced in the source can be determined. From this information, the chemical composition of the original sample (i.e. that both sodium and chlorine are present in the sample) and the isotopic compositions of its constituents (i.e. whether the ratio of 35Cl to 37Cl has been changed by some process) can be determined.
This example was of a sector instrument, however there are many types of mass spectrometers. All of these have in common that they possess an Ion Source, that produces ions, an Analyzer that sorts them in some way by their masses, and a Detector that measures the relative intensities of different masses. The underlying principle of all mass spectrometers is that the paths of gas phase ions in electric and magnetic fields are dependent on their mass-to-charge ratios which is used by the analyzer to distinguish the ions from one another.
Instrumentation
Mass analyzer
Mass analyzers separate the ions according to their mass-to-charge ratio. All mass spectrometers are based on dynamics of charged particles in electric and magnetic fields in vacuum where the following two laws apply:
 ( Lorentz force law)
 (Newton's second law of motion)
where F is the force applied to the ion, m is the mass of the ion, a is the acceleration, Q is the ion charge, E is the electric field, and v x B is the vector cross product of the ion velocity and the magnetic field
Equating the above expressions for the force applied to the ion yields:
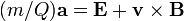
This differential equation is the classic equation of motion of charged particles. Together with the particle's initial conditions it completely determines the particle's motion in space and time and therefore is the basis of every mass spectrometer. It immediately reveals that two particles with the same physical quantity m/Q behave exactly the same. Thus all mass spectrometers actually measure m/Q and strictly speaking should be called mass-to-charge spectrometers. When presenting data, it is common to use the (officially) dimensionless m/z (called mass-to-charge ratio, although (more accurately) it represents the ratio of the mass number and the charge number), where z is the number of elementary charges (e) on the ion (z=Q/e).
There are many types of mass analyzers, using either static or dynamic fields, and magnetic or electric fields, but all operate according to this same law. Each analyzer type has its strengths and weaknesses. Many mass spectrometers use two or more mass analyzers for tandem mass spectrometry (MS/MS). In addition to the more common mass analyzers listed below, there are other less common ones designed for special situations.
Sector
A sector field mass analyzer uses an electric and/or magnetic field to affect the path and/or velocity of the charged particles in some way. As shown above, sector instruments change the direction of ions that are accelerated through the mass analyzer. The ions enter a magnetic or electric field which bends the ion paths depending on their mass-to-charge ratios, deflecting the more charged and faster-moving, lighter ions more. The ions eventually reach the detector and their relative abundances are measured. The analyzer can be used to select a narrow range of m/z or to scan through a range of m/z to catalog the ions present.
Time-of-flight
Perhaps the easiest to understand is the time-of-flight (TOF) analyzer. It uses an electric field to accelerate the ions through the same potential, and then measures the time they take to reach the detector. If the particles all have the same charge, the kinetic energies will be identical, and their velocities will depend only on their masses. Lighter ions will reach the detector first.
Quadrupole
Quadrupole mass analyzers use oscillating electrical fields to selectively stabilize or destabilize ions passing through a radio frequency (RF) quadrupole field. A quadrupole mass analyzer acts as a mass selective filter and is closely related to the Quadrupole ion trap, particularly the linear quadrupole ion trap except that it operates without trapping the ions and is for that reason referred to as a transmission quadrupole. A common variation of the quadrupole is the triple quadrupole.
Quadrupole ion trap
The quadrupole ion trap works on the same physical principles as the QMS, but the ions are trapped and sequentially ejected. Ions are created and trapped in a mainly quadrupole RF potential and separated by m/Q, non-destructively or destructively.
There are many mass/charge separation and isolation methods but most commonly used is the mass instability mode in which the RF potential is ramped so that the orbit of ions with a mass a > b are stable while ions with mass b become unstable and are ejected on the z-axis onto a detector.
Ions may also be ejected by the resonance excitation method, whereby a supplemental oscillatory excitation voltage is applied to the endcap electrodes, and the trapping voltage amplitude and/or excitation voltage frequency is varied to bring ions into a resonance condition in order of their mass/charge ratio.
The cylindrical ion trap mass spectrometer is a derivative of the quadrupole ion trap mass spectrometer.
Linear quadrupole ion trap
A linear quadrupole ion trap is similar to a QIT, but traps ions in a 2D quadrupole field, instead of a 3D quadrupole field as in a QIT. Thermo Fisher's LTQ ("linear trap quadrupole") is an example of the Linear ion trap.
Fourier transform ion cyclotron resonance

Fourier transform mass spectrometry, or more precisely Fourier transform ion cyclotron resonance MS, measures mass by detecting the image current produced by ions cyclotroning in the presence of a magnetic field. Instead of measuring the deflection of ions with a detector such as an electron multiplier, the ions are injected into a Penning trap (a static electric/magnetic ion trap) where they effectively form part of a circuit. Detectors at fixed positions in space measure the electrical signal of ions which pass near them over time producing cyclical signal. Since the frequency of an ion's cycling is determined by its mass to charge ratio, this can be deconvoluted by performing a Fourier transform on the signal. FTMS has the advantage of high sensitivity (since each ion is 'counted' more than once) and much high resolution and thus precision.
Ion cyclotron resonance is an older mass analysis technique similar to FTMS except that ions are detected with a traditional detector. Ions trapped in a Penning trap are excited by an RF electric field until they impact the wall of the trap where the detector is located with ions of different mass being resolved in time.
Orbitrap
The Orbitrap is the most recently introduced mass analyser. In the Orbitrap, ions are electrostatically trapped in an orbit around a central, spindle-shaped electrode. The electrode confines the ions so that they both orbit around the central electrode and oscillate back and forth along the central electrode's long axis. This oscillation generates an image current in the detector plates which is recorded by the instrument. The frequencies of these image currents depend on the mass to charge ratios of the ions in the Orbitrap. Mass spectra are obtained by Fourier transformation of the recorded image currents.
Similar to Fourier transform ion cyclotron resonance mass spectrometers, Orbitraps have a high mass accuracy, high sensitivity and a good dynamic range.
Detector

The final element of the mass spectrometer is the detector. The detector records the charge induced or current produced when an ion passes by or hits a surface. In a scanning instrument the signal produced in the detector during the course of the scan versus where the instrument is in the scan (at what m/Q) will produce a mass spectrum, a record of ions as a function of m/Q.
Typically, some type of electron multiplier is used, though other detectors including Faraday cups and ion-to-photon detectors are also used. Because the number of ions leaving the mass analyzer at a particular instant is typically quite small, significant amplification is often necessary to get a signal. Microchannel Plate Detectors are commonly used in modern commercial instruments. In FTMS and Orbitraps, the detector consists of a pair of metal surfaces within the mass analyzer/ion trap region which the ions only pass near as they oscillate. No DC current is produced, only a weak AC image current is produced in a circuit between the electrodes. Other inductive detectors have also been used.
Tandem mass spectrometry
Tandem mass spectrometry (MS/MS) involves multiple steps of mass selection or analysis, usually separated by some form of fragmentation. A tandem mass spectrometer is one capable of multiple rounds of mass spectrometry. For example, one mass analyzer can isolate one peptide from many entering a mass spectrometer. A second mass analyzer then stabilizes the peptide ions while they collide with a gas, causing them to fragment by collision-induced dissociation (CID). A third mass analyzer then catalogs the fragments produced from the peptides. Tandem MS can also be done in a single mass analyzer over time as in a quadrupole ion trap. There are various methods for fragmenting molecules for tandem MS, including collision-induced dissociation (CID), electron capture dissociation (ECD), electron transfer dissociation (ETD), infrared multiphoton dissociation (IRMPD) and blackbody infrared radiative dissociation (BIRD). An important application using tandem mass spectrometry is in protein identification.
Tandem mass spectrometry enables a variety of experiments. Although it allows for many uniquely designed experiments some types of experiments are commonly used and built into many commercial mass spectrometers. Examples of these include single reaction monitoring (SRM), multiple reaction monitoring (MRM) and precursor ion scan. In single reaction monitoring the first analyzer allows only a single mass through and the second analyzer monitors for a specifically defined fragment ion. MRM is nearly identical except the second analyzer monitors multiple user defined fragment ions. These monitors are most often used with scanning instruments where the second mass analysis event is duty cycle limited. These experiments are used to increase specificity of detection of known molecules such as in pharmacokinetic studies. Precursor ion scan refers to monitoring for a specific loss from the precursor ion. The first and second mass analyzers scan across the spectrum separated by a user defined m/z value. This experiment is used to detect specific motifs within unknown molecules.
Common mass spectrometer configurations and techniques
When all of the elements (source, analyzer and detector) of a mass spectrometer are combined to form a complete instrument and the specific configuration becomes common a new name, often an abbreviation of one or more of the internal components, becomes attached to the specific configuration and can become, within certain circles, more well known than the specific internal components. The most ubiquitous example of this is MALDI-TOF, which simply refers to combining a Matrix-assisted laser desorption/ionization source with a Time-of-flight mass analyzer. The MALDI-TOF moniker is, however, often more widely recognized by the non-mass spectrometrist scientist than MALDI or TOF individually as if inseparable. Other examples include inductively coupled plasma-mass spectrometry (ICP-MS), accelerator mass spectrometry (AMS), Thermal ionization-mass spectrometry (TIMS) and spark source mass spectrometry (SSMS). Sometimes the use of the generic "MS" actually implies a very specific mass analyzer and detection system as with AMS, which is always sector based. In other cases there are common configurations that may be implied but not necessarily.
Certain applications of mass spectrometry have developed monikers that although technically referring to a broad application also tend to indicate a specific or a limited number of instrument configurations. An example of this is isotope ratio mass spectrometry (IRMS). Despite only specifically indicating an application, the use of a limited number of sector based mass analyzers is implied and the name is used to refer to both the application and the instrument used for the application.
Other separation techniques combined with mass spectrometry
An important enhancement to the mass resolving and determining capacity of mass spectrometry is the combination of mass spectrometry with analysis techniques that resolve mixtures of compounds in a sample based on other characteristics before introduction into the mass spectrometer.
Gas chromatography

A common form of mass spectrometry is gas chromatography-mass spectrometry (GC/MS or GC-MS). In this technique, a gas chromatograph is used to separate different compounds. This stream of separated compounds is fed on-line into the ion source, a metallic filament to which voltage is applied. This filament emits electrons which ionize the compounds. The ions can then further fragment, yielding predictable patterns. Intact ions and fragments pass into the mass spectrometer's analyser and are eventually detected.
Liquid chromatography
Similar to gas chromatography MS (GC/MS), liquid chromatography mass spectrometry (LC/MS or LC-MS) separates compounds chromatographically before they are introduced to the ion source and mass spectrometer. It differs from GC/MS in that the mobile phase is liquid, usually a combination of water and organic solvents, instead of gas. Most commonly, an electrospray ionization source is used in LC/MS.
Ion mobility
Ion mobility spectrometry/mass spectrometry (IMS/MS or IMMS) is a technique where ions are first separated by drift time through some pressure of neutral gas given an electrical potential gradient before being introduced into a mass spectrometer.
The drift time is a measure of the radius relative to the charge of the ion. The duty cycle of IMS (time over which the experiment takes place) is longer than most mass spectrometers such that the mass spectrometer can sample along the course of the IMS separation. This produces data about the IMS separation and the mass-to-charge ratio of the ions in a manner similar to LC/MS.
The duty cycle of IMS is short relative to liquid chromatography or gas chromatography separations and can thus be coupled to such techniques producing triply hyphenated techniques such as LC/IMS/MS.
Data and analysis

Data representations
Mass spectrometry produces various types of data. The most ubiquitous data representation is the mass spectrum.
Certain types of mass spectrometry data are best represented as a mass chromatogram. Types of chromatograms include selected ion monitoring (SIM), total ion current (TIC), and selected reaction monitoring chromatogram (SRM), among many others.
Other types of mass spectrometry data are well represented as a contour map. In this form, the mass-to-charge is on one axis, intensity on recorded on another axis, and an additional experimental parameter, such as time, is recorded on the third axis. This results in a three dimensional representation of the data.
Data analysis
Basics
Mass spectrometry data analysis is a complicated subject matter that is very specific to the type of experiment producing the data. There are general subdivisions of data that are fundamental to understand any data.
Many mass spectrometers work in either negative ion mode or positive ion mode. It is very important to know whether the observed ions are negatively or positively charged. This is often important in determining the neutral mass but it also indicates something about the nature of the molecules.
There are many different types of ion sources that behave very differently from each other. A source such as an electron ionization source produces many fragments and mostly odd electron species with one charge, whereas a source such as an electrospray source usually produces quasimolecular even electron species that may be multiply charged.
Tandem mass spectrometry purposely produces fragment ions post-source and can drastically change the sort of data achieved by an experiment.
By understanding the origin of a sample certain expectations can be assumed. For example, if the sample is coming from a synthesis/manufacturing process impurities are likely to be present that are related to the major component. If the sample is a relatively crude preparation of a biological sample, the sample likely contains a certain amount of salt that may form adducts with the analyte molecules in certain analyses.
Results can also depend heavily on how the sample was prepared and how it was run/introduced. An important example is which matrix was used for MALDI spotting, since much of the energetics of the desorption/ionization event is controlled by the matrix rather than the laser power. Sometimes samples are spiked with sodium or another ion-carrying species to produce adducts rather than a protonated species.
The most commonly overlooked basic question by non-mass spectrometrists trying to use mass spectrometry or interact with a mass spectrometrist is what is the over-arching goal of the project. To interpret data one must know the desired outcome (and have collected the right data in the first place). There are many bits of information that can be gleaned from mass spectrometry data, such as the masses of the molecules, the purity of the sample, and the structure of the molecules. Each of these questions requires a different approach. Simply asking for a "mass-spec" will most likely not answer the real question at hand.
Interpretation of mass spectra
Since the precise structure or peptide sequence of a molecule is ciphered trough the set of fragment masses, the interpretation of mass spectra requires combined use of various techniques. Usually the first strategy to identify an unknown compound involves the search of its mass spectrum against a reference library. If the search does not find any matching spectrum manual or software assisted interpretation of mass spectra is performed. Computer simulation of ionization and fragmentation processes occurring in mass spectrometer is the primary tool for assigning structure or peptide sequence to a molecule. An a priori structural information is fragmented in silico and the resulting pattern is compared with observed spectrum. Such simulation is often supported by a fragmentation library that contains published patterns of known decomposition reactions. Software taking advantage of this idea have been developed for both small molecules and proteins.
Another way of interpreting mass spectra involves spectra with accurate mass. An m/z value with integer precision can represent immense number of theoretically possible ion structures. However, accurate mass significantly reduce the number of possible molecular formulas, albeit each can still represent large number of structurally diverse compounds. Computer algorithm called formula generator calculates all molecular formulas that theoretically fit a given mass with specified tolerance.
A recent technique for structure elucidation in mass spectrometry called precursor ion fingerprinting identifies individual pieces of structural information by conducting search of tandem spectra of molecule under investigation against library of product-ion spectra of structurally characterized precursor ions.
Applications
Isotope ratio MS: isotope dating and tracking

Mass spectrometry is also used to determine the isotopic composition of elements within a sample. Differences in mass among isotopes of an element are very small, and the less abundant isotopes of an element are typically very rare, so a very sensitive instrument is required. These instruments, sometimes referred to as isotope ratio mass spectrometers (IR-MS), usually use a single magnet to bend a beam of ionized particles towards a series of Faraday cups which convert particle impacts to electric current. A fast on-line analysis of deuterium content of water can be done using Flowing afterglow mass spectrometry, FA-MS. Probably the most sensitive and accurate mass spectrometer for this purpose is the accelerator mass spectrometer (AMS). Isotope ratios are important markers of a variety of processes. Some isotope ratios are used to determine the age of materials for example as in carbon dating. Labelling with stable isotopes is also used for protein quantification. (see Protein quantitation below)
Trace gas analysis
Several techniques use ions created in a dedicated ion source injected into a flow tube or a drift tube: selected ion flow tube (SIFT-MS), and proton transfer reaction (PTR-MS), are variants of chemical ionization dedicated for trace gas analysis of air, breath or liquid headspace using well defined reaction time allowing calculations of analyte concentrations from the known reaction kinetics without the need for internal standard or calibration.
Atom probe
An atom probe is an instrument that combines time-of-flight mass spectrometry and field ion microscopy (FIM) to map the location of individual atoms.
Pharmacokinetics
Pharmacokinetics is often studied using mass spectrometry because of the complex nature of the matrix (often blood or urine) and the need for high sensitivity to observe low dose and long time point data. The most common instrumentation used in this application is LC-MS with a triple quadrupole mass spectrometer. Tandem mass spectrometry is usually employed for added specificity. Standard curves and internal standards are used for quantitation of usually a single pharmaceutical in the samples. The samples represent different time points as a pharmaceutical is administered and then metabolized or cleared from the body. Blank or t=0 samples taken before administration are important in determining background and insuring data integrity with such complex sample matrices. Much attention is paid to the linearity of the standard curve; however it is not uncommon to use curve fitting with more complex functions such as quadratics since the response of most mass spectrometers is less than linear across large concentration ranges.
There is currently considerable interest in the use of very high sensitivity mass spectrometry for microdosing studies, which are seen as a promising alternative to animal experimentation.
Protein characterization
Mass spectrometry is an important emerging method for the characterization of proteins. The two primary methods for ionization of whole proteins are electrospray ionization (ESI) and matrix-assisted laser desorption/ionization (MALDI). In keeping with the performance and mass range of available mass spectrometers, two approaches are used for characterizing proteins. In the first, intact proteins are ionized by either of the two techniques described above, and then introduced to a mass analyser. This approach is referred to as " top-down" strategy of protein analysis. In the second, proteins are enzymatically digested into smaller peptides using proteases such as trypsin or pepsin, either in solution or in gel after electrophoretic separation. Other proteolytic agents are also used. The collection of peptide products are then introduced to the mass analyser. When the characteristic pattern of peptides is used for the identification of the protein the method is called peptide mass fingerprinting (PMF), if the identification is performed using the sequence data determined in tandem MS analysis it is called de novo sequencing. These procedures of protein analysis are also referred to as the "bottom-up" approach.
Space exploration
As a standard method for analysis, mass spectrometers have reached other planets and moons. Two were taken to Mars by the Viking program. In early 2005 the Cassini-Huygens mission delivered a specialized GC-MS instrument aboard the Huygens probe through the atmosphere of Titan, the largest moon of the planet Saturn. This instrument analyzed atmospheric samples along its descent trajectory and was able to vaporize and analyze samples of Titan's frozen, hydrocarbon covered surface once the probe had landed. These measurements compare the abundance of isotope(s) of each particle comparatively to earth's natural abundance.
Mass spectrometers are also widely used in space missions to measure the composition of plasmas. For example, the Cassini spacecraft carries the Cassini Plasma Spectrometer (CAPS), which measures the mass of ions in Saturn's magnetosphere.
Respired gas monitor
Mass spectrometers were used in hospitals for respiratory gas analysis beginning around 1975 through the end of the century, some are likely still in use but none are currently being manufactured.
Found mostly in the operating room they were a part of a complex system in which respired gas samples from patients undergoing anesthesia were drawn into the instrument through a valve mechanism designed to sequentially connect up to 32 rooms to the mass spectrometer. A computer directed all operations of the system, the data collected from the mass spectrometer was delivered to the individual rooms for the anesthesiologist to use.
This magnetic sector mass spectrometer's uniqueness may have been the fact that a plane of detectors, each purposely positioned to collect all of the ion species expected to be in the samples, allowed the instrument to simultaneously report all of the patient respired gases. Although the mass range was limited to slightly over 120 u, fragmentation of some of the heavier molecules negated the need for a higher detection limit.